Status of science education in SF Bay Area elementary schools
News like this is both sad and frustrating.
A study done by the Lawrence Hall of Science in Berkeley, California conducted a survey asking more than 80 school districts in the San Francisco Bay Area about the state of science education at their school. Here are some of the unfortunate findings:
- About 16 percent of the elementary teachers said they spent no time on science at all. (Most taught at schools that had missed the reading and math benchmarks of No Child Left Behind and were trying to catch up.)
- Most kindergarten to fifth-grade students typically had science instruction no more than twice a week.
- Ten times as many teachers said they felt unprepared to teach science (41 percent) than felt unprepared to teach math (4 percent) or reading (4 percent).
- Fewer than half of Bay Area fifth-graders (47 percent) scored at grade level or above on last spring’s California Standards Test in science. (Only fifth-graders are tested in science at the elementary level.)
I haven’t had the time to read the entire report. The above bullet points are from a news report in the SF Chronicle. The study does have a section titled “Growing Potential for Improvement”…hopefully there are some good ideas in there.
I’m sure some of the other geo-bloggers who are active science educators may have some thoughts about this problem. It seems to me that those of us who run the gauntlet of getting a graduate degree in science aren’t very likely to pursue a career as an elementary school teacher. Some of us might…but, my guess is that the vast majority of us that go into science education will do so at a level where they can utilize their expertise. An elementary school teacher needs to teach everything, not just science.
There are numerous ideas out there for ways to solve these problems…feel free to put some down in the comments.
~~~~~~~~~~~~~~~~~~~~~~~~~~~~~~~~~~~~~~~~~~~~~~~~~~~~~~~~~~~~
Sea-Floor Sunday #2: Submarine landslide
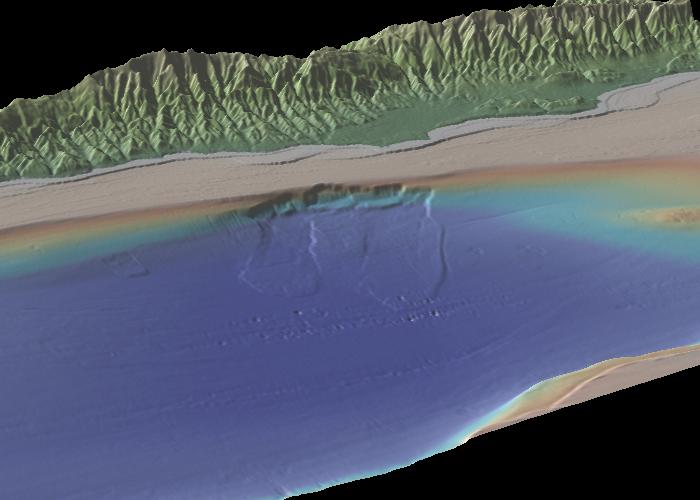
Today’s bathymetric image is from Santa Barbara Basin, offshore southern California. Santa Barbara Basin has received a lot of mud (and very little sand) since the Last Glacial Maximum (~18,000 yrs ago), and therefore has a nice “smooth” look to it in the bathymetry. But, there is a prominent geomorphic feature that pops out. It is a submarine landslide scarp and deposit called the Goleta Slide. Click on the below image for a larger view.

Here’s a blurb from the Monterey Bay Aquarium Research Institution (MBARI) mapping program website:
The Goleta slide is a 134-km2 compound slump and debris flow off Coal Oil Point near Goleta. The slide is 14.6-km long, and is 10.5 km wide, extending from 90 m to nearly 574 m depth. The Goleta landslide is composed of distinct western, central and eastern segments, suggestive of multiple failure events. Each segment contains a well-defined head scarp, down-dropped head block and a slide debris lobe. The debris lobes exhibit hummocky topography in their central areas that appear to result from compression during down slope movement. The toes of the western and eastern lobes are well defined in the multibeam image, whereas the toe of the central lobe is less distinct and presumably older.
Below is another image…this one a perspective image looking north-northeast. The headwall scarps along the continental shelf edge are clearly visible. This one is also worth clicking on for a larger and higher-resolution view.
There have been numerous studies about Goleta slide…I don’t have time right now to go into them in detail. This link will take you to Google Scholar with “goleta slide” in the search box.
These images were produced with a freeware application called GeoMapApp from the Marine Geoscience Data System. Sometimes it’s a little bit clunky to use (not as slick as GoogleEarth), but is a good way to explore for high-res bathymetry data in a global database.
–
UPDATE: You may have found your way here through geology.com/news. Thanks to them for the link! If you want to see more sea-floor images, check these posts out.
Friday Field Foto #33: Patagonia from space
I’ve been working on wrapping up my last chapter for my dissertation lately, which involves a broader scale of investigation. Regular readers know that I have done some work with the sedimentology and stratigraphy of Cretaceous turbidites exposed in the foothills of the Patagonian Andes. That work focuses on depositional processes, relatively fine-scale paleogeomorphology (i.e., channels, lobes, etc.), and stratal architecture.
The last chapter deals with what we can learn about the sediment source area from the basinal formations. I’ve heard some hard-rock geologists complain about sedimentary rocks being merely cover and getting in the way of looking at the “real” rocks. That may be, but consider this: mountains inherently erode — that erosion produces sediment — that sediment is deposited somewhere (a basin) — if were lucky it is preserved over geologic time scales.
So, if you want to find out about ancient mountain belts, you gotta look at the adjacent basin. Obviously, the basinal deposits do not hold all the answers, but we shan’t forget them either. When the whole defense and dissertation is all said and done, I will post more about the details of this project. But, for today, I’m showing a fantastic image of southern South America from space. Click on it to see a larger version. (note: I downloaded this image a few years ago and simply don’t remember where I got it…I will try and track down the source).

You are looking west, that is the Pacific Ocean at the very top of the image. The snow is the Patagonia ice sheet (you can see glaciers coming off of it). This is just the southern tip of the ice sheet – it goes for another several hundred km to the north (to the right on the image). The two large lakes are Lago Argentino (left) and Lago Viedma (right). The rocks we are looking at are exposed in the relatively low mountains just south of Lago Argentino and east of the ice sheet.
Note: this image from way above and taken on a clear day, portrays Patagonia as being rather serene…this is wrong. It’s usually more like this.
Note: if you want to see some more photographs of Patagonia, check out my Flickr page.
Mental preparedness
Tuesday’s moderate earthquake (Mw 5.6) here in the San Francisco Bay Area was the highest magnitude quake since Loma Prieta in 1989. It was also the strongest earthquake I’ve personally experienced (and the first one I’ve blogged about).
I’ve only lived on a plate boundary for about 4 years now. Prior to that, I was in the interior of the North American plate, which has the potential for dangerous seismic activity in certain locations, but overall, moderate to big events are less frequent (which may be arguably even worse for what I’m going to talk about next).
A moderate earthquake is really just right. It reminds you about the fundamental hazard, freaks you (and your cat) out a bit, makes you think twice about the those bottles on the top shelf, and makes you think about your own general preparedness.
As I see it, there are two basic kinds of preparedness. The first kind is the practical kind. This includes the list of stuff you should have at the ready if the infrastructure (power, water, communications, etc.) gets knocked out in the event of a big quake. It also includes things like having a plan with your family about what to do if such an event happens while you are all separated. And there are many other aspects to practical preparedness…I won’t go into that here…that website has tons of information.
The second kind of preparedness is one that I think stems from being an Earth scientist, and a geologist in particular. This is mental preparedness. Geologists know and appreciate probably more than anyone the unstoppable force that is plate tectonics. Even some non-geologists that have lived through multiple earthquakes forget (or, maybe more likely, block out) that it will happen again. Geologists have a unique perspective of the “long view”. We throw around millions of years like its our job! Geologists appreciate that the beauty of a place like the Bay Area, with its hills and interior waterways, was (and still is being) created by plates sliding past each other.
I think the geological perspective leads to the mental preparedness. I am mentally prepared for a big earthquake. I refuse to be one of those people after the fact that say something like “I didn’t think it could happen”. Not only could it happen…it will happen. So, get mentally prepared to accept the consequences.
~~~~~~~~~~~~~~~~~~~~~~~~~~~~~~~~~~~~~~~~~~~~~~~~~~~~~~~~~~~~~~
Earthquake blogging
8:08pm: I’m in San Francisco…I felt it…nothing fell off the shelves, but it got close…our cat freaked out a bit…don’t know any info yet…i’ll update later
~
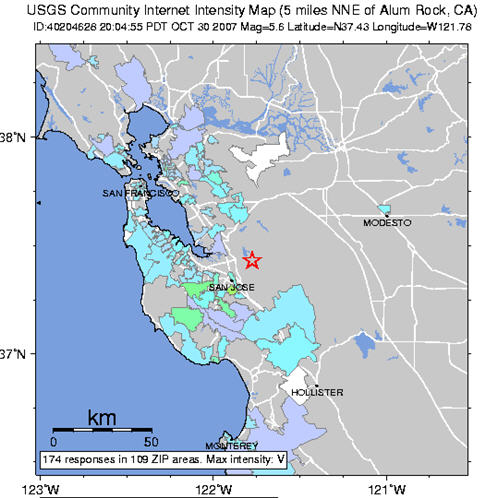
8:16pm: See shake map below…only 12 minutes after quake…right now, it’s a 5.5 according to initial reports…looks like the Hayward fault
~
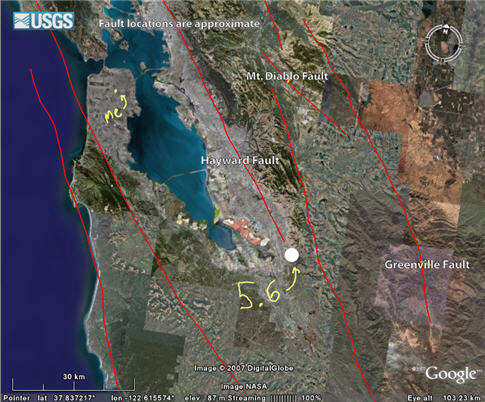
8:45pm: Okay…excitement over…I guess I’ll get back to work. It’s officially a 5.6 according to USGS (see here). See my superbly annotated GoogleEarth image below with epicenter near San Jose in the South Bay, and my location in SF.
~
9:11pm: The very first reports were a little off, and I said it was the Hayward Fault, but I was wrong – it was on the adjacent Calaveras Fault (strike-slip fault). Here’s an updated map from this USGS site.

~
9:48pm: What a great distraction from writing my thesis a moderate earthquake is! I was doing a little reading about the Calaveras fault system (here), and the researchers make this statement regarding forecasting:
We suggest that the 1984 Morgan Hill earthquake, Mw 6.2, is a reasonable maximum magnitude event to occur in these segments, so rather than apply a detailed segmentation model we chose to assume that such an event has an equal likelihood of occurring anywhere along the entire southern Calaveras fault.
Not too shabby…it was a 5.6.
~
10:01pm: For as much time as I spend on my computer and the internet, I can’t believe I never heard of this. Twitter? Apparently, you sign up and then tell people what you are doing at that very moment. Right. Anyway…here’s a screenshot (from this Flickr page) showing the response to the quake. A lot quicker than the news wires, that’s for sure.

~
The Next Day: The updated “Did You Feel It?” map is below. In the very first version of this map (top of post), there were 174 responses in only ~15 minutes. Now there are over 61,000 responses. This is one of those things where the value of a networked world is appreciated. Fantastic.

~~~~~~~~~~~~~~~~~~~~~~~~~~~~~~~~~~~~~~~~~~~~~~~~~~~~~~~~~~~~~~~
If you happen to be at the GSA meeting in Denver…
…you’re lucky. I wish I was there instead of writing this last chapter of my dissertation…sigh…
Anyway, if you are going to be there on Wednesday afternoon and aren’t completely burned out from too much science (never!), I am a co-author for a poster about the Cretaceous turbidites we’ve been studying in Patagonia for a few years now. My colleague and first author, Steve, will be manning the poster all afternoon.
Session No. 235–Booth# 42
Sediments, Clastic (Posters)
Colorado Convention Center: Exhibit Hall E/F
1:30 PM-5:30 PM, Wednesday, 31 October 2007
Stop by and ask him if he thinks the ancient submarine channel-complexes are sinuous…and then ask him for proof. And then say hi for me.
Check out the abstract here.
~~~~~~~~~~~~~~~~~~~~~~~~~~~~~~~~~~~~~~~~~~~~~~~~~~~~~~~~~~~~~~
Blogging on Peer-Reviewed Research
Some of you may have been following the progress of this initiative, but in case you haven’t, I urge you to go to the Bloggers for Peer-Reviewed Research Reporting (BPR3.org) website and get up to speed. It will be interesting to see how this all works out…I think it is a very cool idea.
Here’s the deal: Most of us science bloggers, from time to time, put in a little extra effort and write a post about a specific paper/study (or even dig back into older literature) and analyze it in more detail. Well, the folks over at BPR3.org have designed an icon that will identify your post as such. Here’s what Dave Munger has to say:
We’re pleased to announce that BPR3’s Blogging on Peer Reviewed Research icons are now ready to go! Anyone can use these icons to show when they’re making a serious post about peer-reviewed research, rather than just linking to a news article or press release.
Within a month, these blog posts will also be aggregated here, so everyone can go to one place to locate the most serious, thoughtful analysis and commentary on the web
The automated aggregation of these types of posts has interesting potential for those looking for ‘one-stop shopping’ of science bloggers analyses on peer-reviewed papers/studies. The above quote is from here…go there to learn more about how all this works.
UPDATE: It seems the BPR3.org site is down…hopefully it will be up soon.
UPDATE UPDATE: It’s back up.
~~~~~~~~~~~~~~~~~~~~~~~~~~~~~~~~~~~~~~~~~~~~~~~~~~~~~~~~~~~~~~
Sea-Floor Sunday #1: Golden Gate sandwaves
Okay, so I said this blog was gonna be quiet, but hey it’s the weekend. My post yesterday about global warming and petroleum geology was something that was in the oven for some time so I decided to take a half an hour and finish it up.
Today, I’m introducing a new feature on Clastic Detritus. Sea-Floor Sundays will be similar to the ongoing Friday Field Foto serial, but will focus on bathymetric images of our ocean floor. My own interests and training will likely bias me towards sedimentary features but I will try to include images from a broad variety of features.
For the first edition, I’m going to re-run a post from several months ago. Firstly, I’m feeling a little too busy to start searching the internet for cool images…once I go down that path, a couple hours can disappear easily. Secondly, newer readers to Clastic Detritus may have not seen this unless they dug into the old posts.
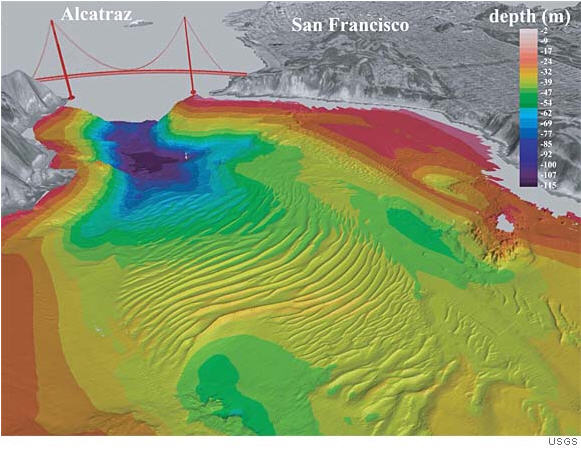
High-resolution sea-floor mapping done in 2004 and 2005 by the US Geological Survey (USGS) and Cal State Monterey Bay (CSUMB) reveals a field of gigantic sand waves just west of the Golden Gate of San Francisco Bay (click on image for larger view).
More than 40 large sand waves were mapped, with crest-to-crest lengths of as much as 220 meters and heights of as much as 10 meters. Although the tidal range is not huge here, the narrowness of the Golden Gate straight augments the tidal force significantly (tidal currents > 2.5 m/s). Note in perspective bathymetric images how the area directly under the bridge (blue/purple colors) is kept clean of sediment.
Here is a short synopsis from the USGS’s website.
Here is an article from the San Francisco Chronicle from 2006.
Check this out for another submarine view of San Francisco Bay.
~~~~~~~~~~~~~~~~~~~~~~~~~~~~~~~~~~~~~~~~~~~~~~~~~~~~~~~~~~~~~~
Global warming and petroleum geology
Although I am primarily, and fundamentally, a sedimentary geologist, I do have some experience applying geologic principles for oil companies. I am, by no means, however, an experienced prospector or seasoned petroleum geologist. I’m saying this up front to try and head off any comments about my limited experience in the industry. This post is about a perspective within the context of my own scientific training, not a statement intended to represent a (mythical) monolithic view people crave. Also, I think it’s important to remember the distinction between petroleum geology and the petroleum industry.
~
CLIMATE CHANGE COMMENTS FROM PETROLEUM GEOLOGISTS
Over the past several years I’ve seen comments from some petroleum geologists that have a tone similar to the following:
Geologists study the history of the Earth and realize climate has changed often in the past due to natural causes. The Earth’s climate naturally varies constantly, in both directions, at varying rates and on many scales. In recent decades global temperatures have risen. Yet, our planet has been far warmer and cooler than today many times in the geologic past, including the past 10,000 years.
Actually, that is an excerpt from the American Association of Petroleum Geologist’s (AAPG) 2007 statement on climate change. I’m sure many of you have either read a comment similar to that or heard someone say something like that at some point. AAPG’s statement is better than it used to be thanks to its members. Here’s what the AAPG President had to say about the issue in March 2007:
Members have threatened to not renew their memberships if … AAPG does not alter its position on global climate change. And I have been told of members who already have resigned in previous years because of our current global climate change position.
And, although the current statement is better, it still includes a tone that follows this logic:
Because past climate changed naturally, modern climate change is natural.
— AND/OR —
Because Earth survived past climate changes, there’s little reason to worry about modern climate change.
Either way, the rationalization is that nothing needs to be done. The AAPG statement itself does not explicitly say these things, but I hear them often from some in petroleum geology. These lines of reasoning are nonsensical and do not deserve yet another deconstruction on a blog. The “official” position of the powers-that-be at AAPG is also not the subject of this post. What I do want to discuss is a different perspective on climate change that is grounded firmly and very specifically in petroleum geology.
~
GENERATION AND ACCUMULATION OF OIL IN THE EARTH
 At this point I’d like to briefly review some petroleum geology basics. Like most natural systems, the origin, generation, migration, and accumulation of hydrocarbons is an extraordinarily complex affair. The transformation of organic matter (mostly tiny marine life, not dinosaurs) into some type of hydrocarbon requires elevated temperatures and pressures. If long-term net deposition of sediment buries sufficient volumes of organic matter to the “oil kitchen”, about 60-120° C, there is a chance the organic matter will transform into hydrocarbons (it is obviously more complicated than this, but I want to keep this brief…find out more). Liquid or gas hydrocarbons are mobile and will migrate upwards through permeable layers of the stratigraphic column (read a recent post about this at Olelog here). Most of the oil naturally formed on Earth has escaped from the subsurface over very long time periods. However, if a seal rock (i.e., impermeable) and a “trap” exist, large volumes of oil can accumulate in relatively porous sedimentary rocks. These large accumulations are what we have discovered and from which we extracted oil.
How long have subsurface accumulations of oil been around? Well, it really depends in which sedimentary basin you are looking. Different basins have different ages of petroleum source rocks and different ages of maturation/migration. Here’s a quote directly from a 1999 study by Klemme and Ulmishek, hereafter referred to as K&U [1]:
More than 90% of original recoverable oil and gas reserves in the world has been generated from source rocks of six stratigraphic intervals–(1) Silurian (generated 9% of the world’s reserves), (2) Upper Devonian-Tournaisian (8% of reserves), (3) Pennsylvanian-Lower Permian (8% of reserves), (4) Upper Jurassic (25% of reserves), (5) middle Cretaceous (29% of reserves), and (6) Oligocene-Miocene (12.5% of reserves)
But this is the age of the source rock, not the age of the oil. A organic-rich source rock can sit around for some time before actually generating hydrocarbons. The plot below, also from K&U, shows geologic time on the x-axis and petroleum reserves (as a percentage) on the y-axis (click on it for a slightly less fuzzy version).
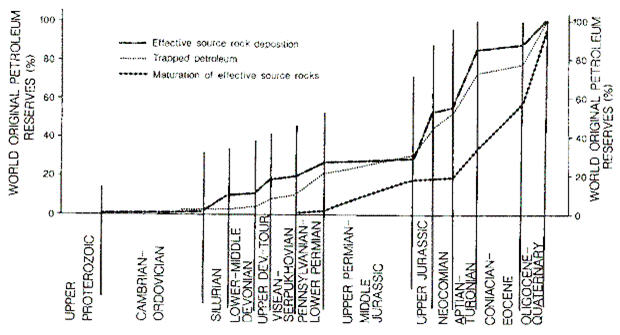
Note the lower dashed line…this is the age of maturation of the world’s oil. Here’s what K&U say about this (italics are mine):
The cumulative maturation line demonstrates the generally young age of most of the world’s discovered oil and gas. Almost 70% of the world’s oil and gas reserves was generated since the Coniacian (~87 million yrs ago), and nearly 50% of the reserves was generated and trapped since the Oligocene (~30 million years ago).
In a rigorous sense, it’s invalid to try and determine a single number for the time it has taken for the Earth’s hydrocarbons to mature. For the sake of this post, however, I’m going to do it anyway. Let’s be very conservative and say that the oil extracted thus far took, on average, about 20 million years to mature and accumulate.
~
PERTURBING THE SYSTEM
The Earth’s carbon cycle has various sources and sinks that interact over various time scales that collectively circulate carbon among the spheres (litho, bio, hydro, atmo, etc.). Storage and transfer of CO2 among the components drives the system towards an equilibrium. As we know, however, a state of true equilibrium is never attained. The system is dynamic, it is in a state of constant adjustment, always responding to various perturbations, both external and internal (e.g., feedbacks) to the system.
In only 150 years we’ve released CO2 that took 20 million years to accumulate. Put another way, the duration of release is a mere 0.000008% of the duration of accumulation. The evidence for “excess” CO2 input to the system is the measured increase in CO2 concentration in the atmosphere (i.e., not all of it is being cycled back into sinks). In other words, from the geological perspective, the current rate of CO2 concentration in the atmosphere is extremely rapid. Does this imbalance in cycling of Earth materials significantly perturb the system? My petroleum geological perspective leads me to answer “yes indeed”.
One might argue that the Earth has experienced rapid increases of greenhouse gases in the atmosphere in the geologic past and survived just fine. The confusion of a planet’s survival with that of effects on habitability notwithstanding let’s consider the best known example a rapid global warming from the geologic past – the Paleocene-Eocene Thermal Maximum (PETM). Although this occurred 55 million years ago, records indicate the global warming occurred in less than 10,000 years [2, 3, 4]. The temporal resolution of archives going back that far is inherently lower thus making it very possible the event occurred over an even shorter time period. In other words, the system was significantly perturbed. Included among the effects of this perturbation was an increase in global temperatures by ~5° C [5], oceanic acidification [6], and a mass extinction of benthic foraminifera [7]. Although the exact cause(s) of the CO2 release are debated (e.g., 8 and 9), the point for this post is that something happened and it had significant effects on the biosphere. Furthermore, it has been postulated that it took 100,000 years for the carbon cycling system to “recover” from the abrupt increase in CO2 (i.e., for it to be absorbed in the ocean) [10].
~
A GEOLOGICAL PERSPECTIVE ON CLIMATE CHANGE
The whole point of this post is to present a perspective of global climate change that is rooted in petroleum geology that people may not hear about. Yes, of course the science of understanding petroleum systems is intimately intertwined with the business of production (oil companies) and consumption (you), but I would reiterate that they are also distinct. Petroleum geology is just that — it is geology. While some may cite the long-view afforded by a geological perspective as a reason to not be concerned about the effects of climate change, I think that it is quite the opposite. Perturbations to Earth’s carbon cycling system, and the significant impacts it can have on short-term habitability for components of the biosphere, is better appreciated with a geological perspective.
————————
References cited above:
[1]: http://www.searchanddiscovery.net/documents/Animator/klemme2.htm (note: this page condensed from their article published in the AAPG Bulletin, v. 75, 1991, p. 1809-1851; reprinted and adapted on the Search and Discovery website)
[2]: Zachos, J. C. et al., Science 302, 1151–1154 (2003)
[3]: Kennett, J. P. & Stott, L. D. , Nature 353, 225–229 (1991)
[4]: Tripati, A. & Elderfield, H., Science 308, 1894–1898 (2005)
[5]: A. Sluijs et al., Nature 441, 610 (2006)
[6]: J. C. Zachos et al., Science 308, (2005)
[7]: S. L. Wing et al., Eds., Causes and Consequences of Globally Warm Climates in the Early Paleogene, Geological Society of America special paper 369 (2003)
[8]: Dickens, G. R. , O’Neil, J. R. , Rea, D. K. & Owen, R. M. Dissociation of oceanic methane hydrate as a cause of the carbon isotope excursion at the end of the Paleocene. Paleoceanography 10, 965–971 (1995)
[9]: M. Pagani et al., Science 314, (2005)
[10]: http://www.physorg.com/news4491.html
Hydrocarbon molecule image from here
~~~~~~~~~~~~~~~~~~~~~~~~~~~~~~~~~~~~~~~~~~~~~~~~~~~~~~~~~~~~~~
The Google searching meme
I’ve been away from the blogosphere for the past week or so and saw today an interesting meme going around regarding what Google search terms bring up your own blog as the number one hit. See more about this here, here, and here.
I didn’t spend a lot of time on this — but here are five search terms that bring up Clastic Detritus as the number one hit:
- stratigraphy blog
- theoretical stratigraphy (#1 hit is actually to old blog)
- sadler effect
- luggage sediment
- highstand fans
Another fun thing to do is to look at the search terms in the blog stats for the last couple days and see some of the interesting terms that lead people to this blog. Here are just a few:
- cyberspace visualize
- futon frame opinion
- unclos 350 miles map
- chicken no head
- transformers cake
- sarcasticity
~~~~~~~~~~~~~~~~~~~~~~~~~~~~~~~~~~~~~~~~~~~~~~~~~~~~~~~~~~~~
