Sea-Floor Sunday #1: Golden Gate sandwaves
Okay, so I said this blog was gonna be quiet, but hey it’s the weekend. My post yesterday about global warming and petroleum geology was something that was in the oven for some time so I decided to take a half an hour and finish it up.
Today, I’m introducing a new feature on Clastic Detritus. Sea-Floor Sundays will be similar to the ongoing Friday Field Foto serial, but will focus on bathymetric images of our ocean floor. My own interests and training will likely bias me towards sedimentary features but I will try to include images from a broad variety of features.
For the first edition, I’m going to re-run a post from several months ago. Firstly, I’m feeling a little too busy to start searching the internet for cool images…once I go down that path, a couple hours can disappear easily. Secondly, newer readers to Clastic Detritus may have not seen this unless they dug into the old posts.
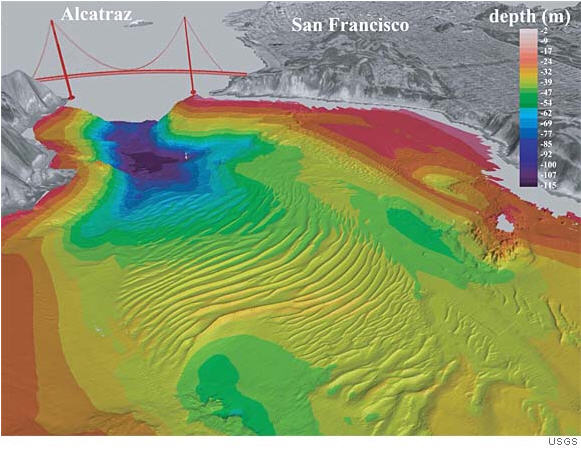
High-resolution sea-floor mapping done in 2004 and 2005 by the US Geological Survey (USGS) and Cal State Monterey Bay (CSUMB) reveals a field of gigantic sand waves just west of the Golden Gate of San Francisco Bay (click on image for larger view).
More than 40 large sand waves were mapped, with crest-to-crest lengths of as much as 220 meters and heights of as much as 10 meters. Although the tidal range is not huge here, the narrowness of the Golden Gate straight augments the tidal force significantly (tidal currents > 2.5 m/s). Note in perspective bathymetric images how the area directly under the bridge (blue/purple colors) is kept clean of sediment.
Here is a short synopsis from the USGS’s website.
Here is an article from the San Francisco Chronicle from 2006.
Check this out for another submarine view of San Francisco Bay.
~~~~~~~~~~~~~~~~~~~~~~~~~~~~~~~~~~~~~~~~~~~~~~~~~~~~~~~~~~~~~~

Trackbacks