Text cloud for two of my papers
I have two papers from my Ph.D. research currently in review – one in Sedimentology and one GSA Bulletin. The one in Sedimentology is getting very close to being ‘in press’ … I’m working with the associate editor right now clearing up some issues. The one for GSA Bulletin was submitted in late December, so I expect I’ll get the first reviews back in the next month or so.
I’m looking forward to posting about these projects on this blog, but I also feel it’s important to wait until they are published before I do that.
In the meantime, I was playing around with a tag cloud generator (the one I used is called TagCrowd) for each of the papers. I’m a big fan of tag clouds and other visualization approaches, in general, and was curious what the text from one of my scientific papers would look like.
Here’s the text cloud for the paper in Sedimentology:
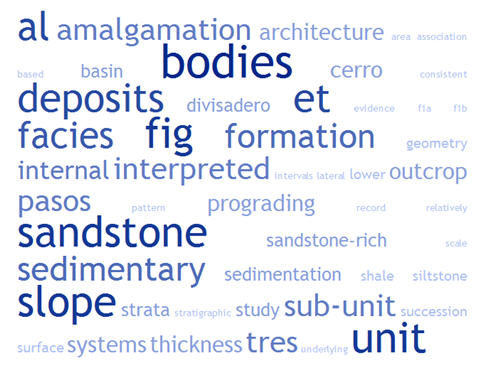
Firstly, you can see how many times I have “et al” in there … those are among the most frequent. Same with the shorthand for figure as “fig”. The rest will remain a mystery for now :)
And, here’s the text cloud for the paper in GSA Bulletin:
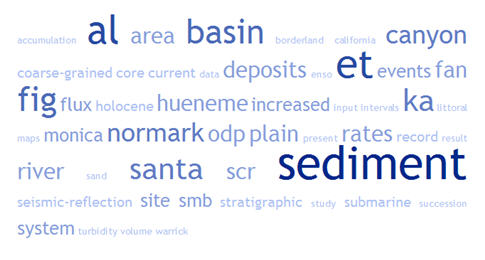
This is pretty cool … you can get a decent idea about what the papers are about from these visualizations. Give it a shot … it might be cool to see how everyone around the geoblogosphere compares. Use a thesis chapter, proposal, paper for class, published paper, etc. Like I said, I used TagCrowd, but there are probably others. I found the best results by pasting the text in instead of uploading a file.
–
THE PUBLICATION TEXT-CLOUD MEME CAUGHT ON!:
Chuck from Lounge of the Lab Lemming
ReBecca over at Dinochick Blogs
Maria from Green Gabbro
Chris from Highly Allocthonous
Kim from All Of My Faults Are Stress-Related
Silver Fox from Looking For Detachment
Julian from Harmonic Tremors
Tuff Cookie from Magma Cum Laude
Dave from Geology News (this one shows results from his entire blog)
Callan from NOVA Geoblog
Lost Geologist from The Lost Geologist
–
… and the meme made it out of the geoblogosphere:
SPARC at molecular B(io)LOG(y)
~~~~~~~~~~~~~~~~~~~~~~~~~~~~~~~~~~~~~~~~~~~~~~~~~~~~~~~~~~~~~~~~~~~~~~~~~~~~~~~~~
Political pandering about energy
I’m in a bit of ranty mood this morning … read on for knee-jerk reactions that may or may not make any sense or be of any value.
I found myself watching cable news this morning* and Hillary was talking about rising gasoline prices. Here’s a few highlights of what she said:
1) She wants to make oil companies pay federal gas tax (as opposed to suspending the tax as McCain proposes). Yeah, right. Like there’s any chance that measure could even get in the hopper, much less passed in the next month. Even if something like this happened, it would take a year or so of debate. It’s populist pandering … “hey, look at me, I hate large corporations just like you!”
2) She wants congress to start serious investigations into why gas prices are rising. Huh? Is there a crime here? What is it? Actually, maybe they should investigate … then they can educate the public about economics how much they actually consume. Oh wait … it’s not the public’s fault … must be somebody else’s.
3) She is convinced energy traders are driving up price of oil. I’m not sure what she’s getting at with that. She said it with such aggressiveness and disdain – with an implication that there is some diabolical scheme underfoot. If we look at the plain words of the statement – well, yes, the day-to-day actions of energy traders does impact the price of oil. It’s a commodity like any other. What exactly is your point, Hillary?
4) Then she said that we (i.e., America) should release oil from the SPR (Strategic Petroleum Reserve) to send a message to oil companies and OPEC that we’re serious. What the hell does that mean? Who is serious and what are they being serious about? What’s the message?
Pure political pandering. Yawn.
You know what America? Gas prices are high? I’m sorry, but tough shit. Stop buying so much of it!! It’s supply and demand – it’s not that difficult to understand. The rest of the world seems to understand this equation.
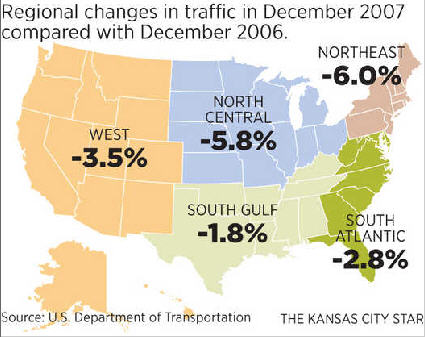
Call me a cynic, but real changes in our energy situation will only come when people start feeling it economically. I think things are starting to happen – GM has seen a 27% drop and Ford a 36% drop in SUV sales and a huge increase in sales of smaller/hybrid cars since last year (I don’t have a link for those numbers, the TV people said it as I write this). The map below (from this article) also shows a nationwide decrease in driving. Did people decide that taking the bus or carpooling was the “right” thing to do? Maybe some of them did, but I would guess that most are trying to save money.
At this point, maybe you’re saying to yourself “but this happened in the 70s, everybody started buying smaller, more fuel-efficient cars…but, then prices went back down and the trend reversed”. That’s true. Will that happen again this time? I don’t know, perhaps. A lot depends on what OPEC decides to do … their hand on the global oil faucet is what contributed to a lot of what happened in the early 1970s. I’m no energy expert, but it seems to be fundamentally different this time.
~
* I rarely watch the 24-hour cable news channels. I am not at all surprised with the rising anti-intellectual sentiment in this country. They are so patronizing – treating the viewer as a complete and utter idiot. Hey, if you can’t follow the basic news of the country and world, tough. You treat people like children and apathetic morons … then, that’s what they become.
~~~~~~~~~~~~~~~~~~~~~~~~~~~~~~~~~~~~~~~~~~~~~~~~~~~~~~~~~~~~~~~~~~~~~~~~~~~~~~~~~~
Inspired by Dynamic Earth’s latest posts on modern/Recent sedimentation in Death Valley (see here and here), I decided to post one of my own photos from Death Valley for this week’s Friday Field Foto.
I forgot exactly where this location is (I’ll have to look at my notes), but it’s representative of the kinds of modern deposits you’ll find in the fans in the Death Valley/Owens Valley region.

Similar to the last photo in this post, deposits from the most recent events stand out nicely as a function of color (the light gray). What I like about this particular deposit is that you can pick out the levees in the upper right part of the photo. In these types of flows, the chunky stuff (i.e., coarser-grained material) get pushed to the front and the sides of the flow. As the flow moves down slope, levees of coarser material develop. Next time you are in Death Valley, go walk around on almost any alluvial fan and you should find this (some better developed than others).
Now move down slope from the leveed area … note how the distribution of the lighter material is starting to spread out a bit. Finally, at the terminus of the deposit, you’ll see some very nice debris lobes. One of the coolest aspects of visiting these features on field trips is that you can see the products of a single event (or series of multiple events closely related) in a relatively small area.
Happy Friday!
~~~~~~~~~~~~~~~~~~~~~~~~~~~~~~~~~~~~~~~~~~~~~~~~~~~~~~~~~~~~~~~~~~~~~~~~~~~~~~
Coming soon … Google Ocean!
I’ve been so patient …
Finally, it seems that Google will do what I’ve been literally dreaming about. Below are excerpts from an article discussing the upcoming addition to GoogleEarth — adding higher resolution bathymetry data (you can read the whole article here).
The tool–for now called Google Ocean, the sources say, though that name could change–is expected to be similar to other 3D online mapping applications. People will be able to see the underwater topography, called bathymetry; search for particular spots or attractions; and navigate through the digital environment by zooming and panning.
Yes!
Google Ocean will feature a basic layer that shows the depth of the sea floor and will serve as a spatial framework for additional data, sources said, adding that Google plans to try to fill in some areas of the map with high-resolution images for more detail.
I’m so excited.
On top of the depth map, and in addition to the select high-resolution tiled areas, there will likely be various layers of specialized data from different sources. For example, NOAA already has made public visual information for Google Earth related to sea hotspots around coral reefs, Gulf of Mexico marine debris, surface temperatures and wave heights in the Great Lakes, and shipwrecks.
Hotspots, reefs, and shipwrecks are indeed cool … but don’t forget submarine fans!
~~~~~~~~~~~~~~~~~~~~~~~~~~~~~~~~~~~~~~~~~~~~~~~~~~~~~~~~~~~~~~~~~~~~~~~~~~~~~
Suspend federal gasoline tax?
Lab Lemming’s back-of-the-envelope calculation of the effect of a carbon tax on fuel got me thinking about the general issue of taxing transportation fuel.
If you live in the United States, you’ve probably heard some discussion about suspending the federal gasoline tax (18.4 cents/gallon) to help alleviate a slumping economy. The New York Times has an article about it today, which you can read here. The article is mostly about the issue within the context of the two remaining Democratic presidential candidates, Obama and Clinton.
I’m not going to talk about the Democratic race because I think it’s boring. The 24-hour news channels are having so much fun parsing every. single. word. they. say. They’re more interested in “gotcha” journalism and meaningless fluff. I neither have the time nor the brain cells to waste on it. Wake me up after the convention. If anything will be the demise of modern democracy it’ll be mainstream tabloids media, but I digress.
Anyway … back to the federal gasoline tax. It’s original purpose was to provide revenue for highway construction and improvements. It appears to have expanded and become a bit more complex since then, but still meant to be for our public transportation system (which in the U.S. is mostly about roads).
I’m mostly posting to see what you all think. I’m not an economist, I’m not sure what the effects, positive or negative would be. Truckers are definitely hurting with higher fuel prices*. Perhaps suspending the tax, either partially or in full, for commercial truckers but not for regular drivers could work? I’ve said several times in the past that I think the higher fuel prices are good for Americans in the long term. I really think we need a wake-up call regarding our energy usage. But, that’s me … we don’t drive that much, and we have a car with good gas mileage. In other words, I would rather see the tax used for what it was designed for.
Any thoughts?
–
* Yes, I know the price of gas in the U.S. still isn’t nearly as much as it is in Europe or other countries … it seems it’s more about the rate of increase that can really wreak havoc.
~~~~~~~~~~~~~~~~~~~~~~~~~~~~~~~~~~~~~~~~~~~~~~~~~~~~~~~~~~~~~~~~~~~~~~~~~~~~~~~~
Some photos from a nice weekend hike
We went for a really nice hike this weekend to the southern part of Point Reyes, a bit north of San Francisco. The destination for the hike was a place called Alamere Falls. The captions for the following photos are below the image.

A dense grove of Eucalyptus trees.

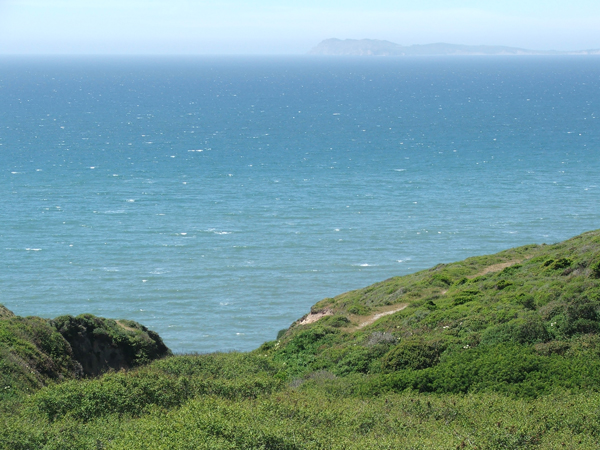
Looking south towards the very southern end of the Point Reyes area.

Point Reyes proper off in the distance. It was an absolutely gorgeous day … perfect weather for a hike.

Another view looking north. The trail came in and out of the woods giving us these spectacular views.

The wildflowers are still good this time of year, although not as numerous and dense as they were a few weeks ago. Does anyone know what kind of flower this is?
Yet another view northwest with Point Reyes in the distance.

The poppy, the California state flower.
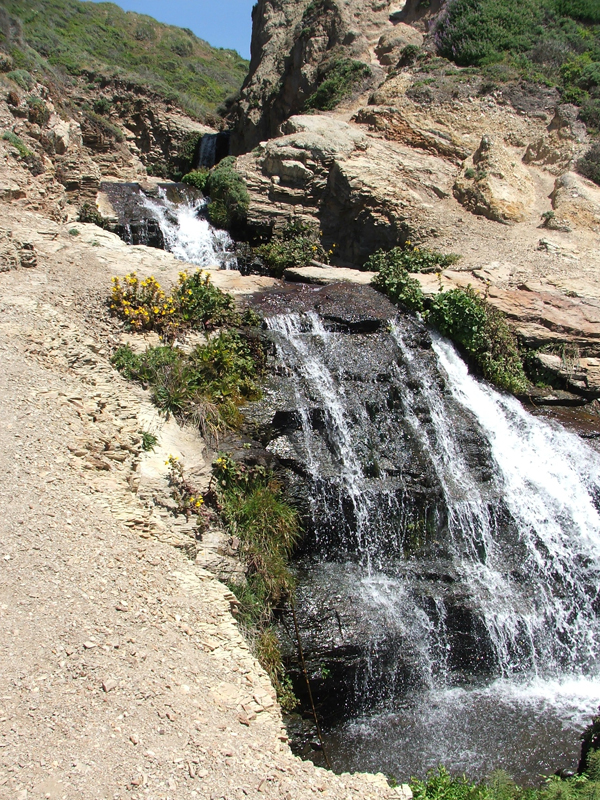
The end of our 3.5 mile hike was this waterfall coming out at the beach, called Alamere Falls.
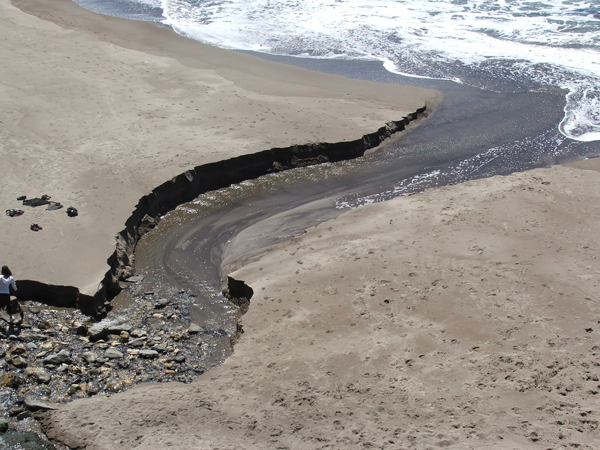
No hike is complete without a little sedimentary geology … this is the outwash of the stream and waterfall at the beach. My next post will show some movies from that stream.
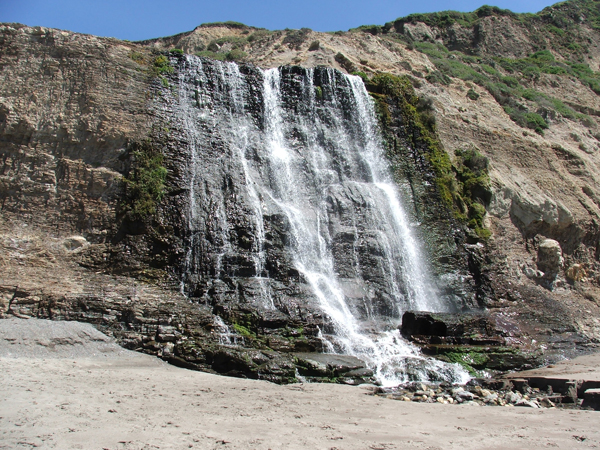
Here’s a view from the beach looking back up at Alamere Falls. That cliff is about 20 meters tall, give or take. It was a great hike.
~~~~~~~~~~~~~~~~~~~~~~~~~~~~~~~~~~~~~~~~~~~~~~~~~~~~~~~~~~~~~~~~~~~~~~~~~~~
Sea-Floor Sunday #17: Ocean Floor Globe
Before you get your hopes up … unfortunately, this product has been discontinued. I don’t think I would’ve forked over the cash anyway, but it’s pretty dang cool.
It’s a globe with the sea floor 60X vertically exaggerated.
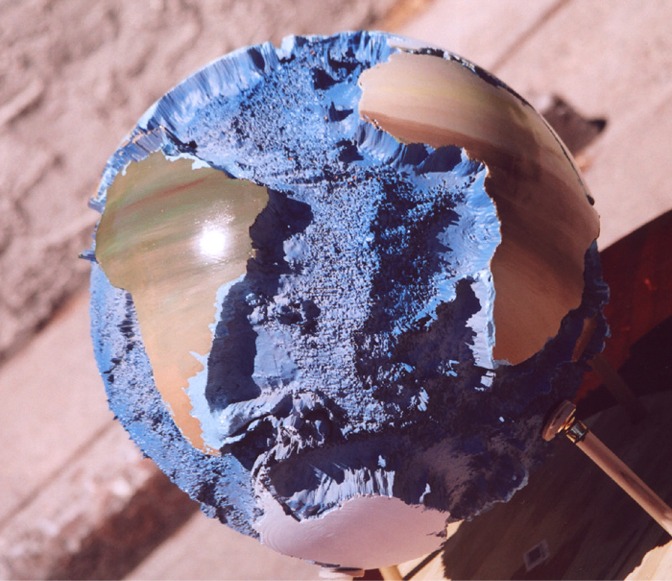
I was going to show a real bathy image as I usually do for Sea-Floor Sunday but came across this and couldn’t resist. I found it on this site, which has tons of other globe products.
~~~~~~~~~~~~~~~~~~~~~~~~~~~~~~~~~~~~~~~~~~~~~~~~~~~~~~~~~~~~~~~~~~~~~~~~~~~~~~~
If you ever find yourself around Guadalupe Mtns National Park in west Texas and southeastern New Mexico, take a day to do the hike up Shumard Canyon on the Western Escarpment. It’s a full day and parts of it quite strenuous, but worth it. To do it, you need to get a key from the park ranger for the Williams Ranch trail. The trailhead is at the end of 4-wheel drive road that can get washed out sometimes … takes about a half-hour to drive it.
When you get up into Shumard Canyon you’ll be within an ancient submarine canyon succession (the siliciclastic and turbiditic Brushy Canyon Formation overlying the carbonate Cutoff and Victorio Peak formations). One particularly spectacular exposure of the Brushy Canyon is a vertical cliff of nearly 100% plane- and ripple-laminated fine sandstone.
The photograph below is a vertical mosaic taking advantage of the vertical layout of a blog post. You’ll have to scroll down to see a person for scale. In addition to the within-bed sedimentary structures, there are a few intervals of inclined stratification that one might interpret as a large bedforms or barforms. For a slightly bigger version, click on photo.
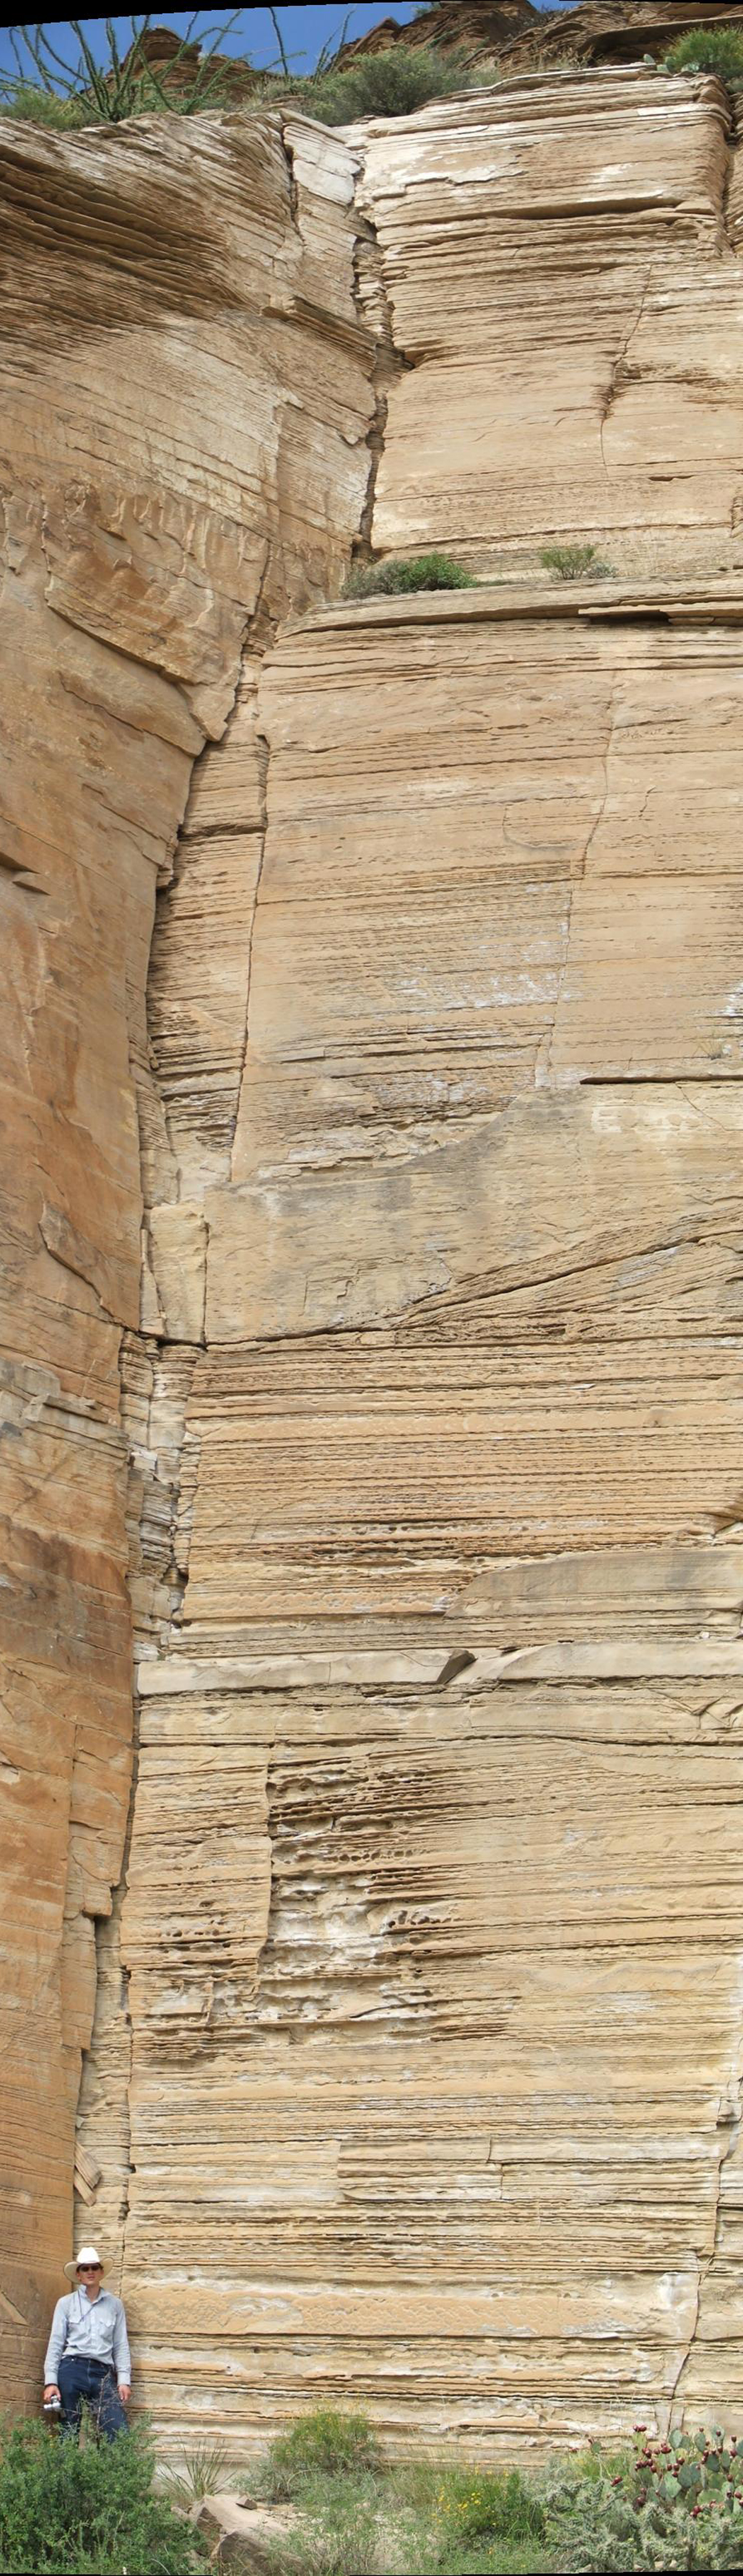
For you turbidite geeks, one thing to consider … if you didn’t have the context of this area being within a submarine canyon-fill, do you think you would interpret it that way?
Happy Friday!
–
check out more photos from a trip to this region last September
~~~~~~~~~~~~~~~~~~~~~~~~~~~~~~~~~~~~~~~~~~~~~~~~~~~~~~~~~~~~~~~~~~~~~~~~~~~~~~~~~~~
Airport blogging
I’m on my way home from a conference in San Antonio … i’m sitting in the Dallas/Ft. Worth airport waiting for my connection and … oh crap, look at this:
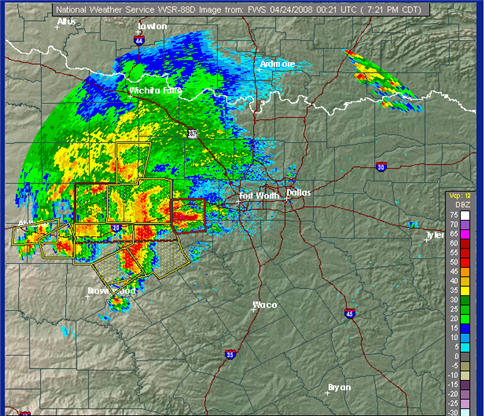
That sucks.
Anyway, the conference went well … very busy with talk, poster, and chairing a session but it was fun. I saw some great talks and posters, mostly within my specialty of deep-marine sedimentology and stratigraphy. A great combination of research focused on numerical/physical modeling of turbidity currents, Quaternary systems, and ancient systems (both subsurface and outcrop). I really enjoy getting researchers with various talents and approaches together to discuss the challenges we face in unraveling geologic problems.
While away from my computer for a couple days, I missed the Earth Day edition of The Accretionary Wedge geo-blog carnival. It was hosted by Andrew over at about.com and can be found here. Good stuff, check it out.
Back to regular blogging soon (if I ever make it out of Dallas).
UPDATE: It did suck. They put us on the plane just as the most severe part of the storm hit the airport. Then we sat at the gate for an hour. As the storm dissipated we starting taxiing with all the other planes. Then they said the winds shifted, so we all taxied to the other side of the runway. Then we waited another 45 minutes as all the planes that were circling the airport waiting to land had to land (fair enough). Then, the winds shifted back and we all taxied back to the other side. Awesome … I spent more time on the plane on the ground than in the air. Ahh … I love traveling.
~~~~~~~~~~~~~~~~~~~~~~~~~~~~~~~~~~~~~~~~~~~~~~~~~~~~~~~~~~~~~~~~~~~~~~~~~~~~~~~~
Sea-Floor Sunday #16: Gulf of California
My second post in the Sea-Floor Sunday series used a couple images using the GeoMapApp freeware. This is a great tool for visualizing our planet’s bathymetry.
Today’s image is a very nice perspective bathymetric image of the Gulf of California region. I didn’t make this image, it is featured on GeoMapApp’s gallery page (you can find it and more here).
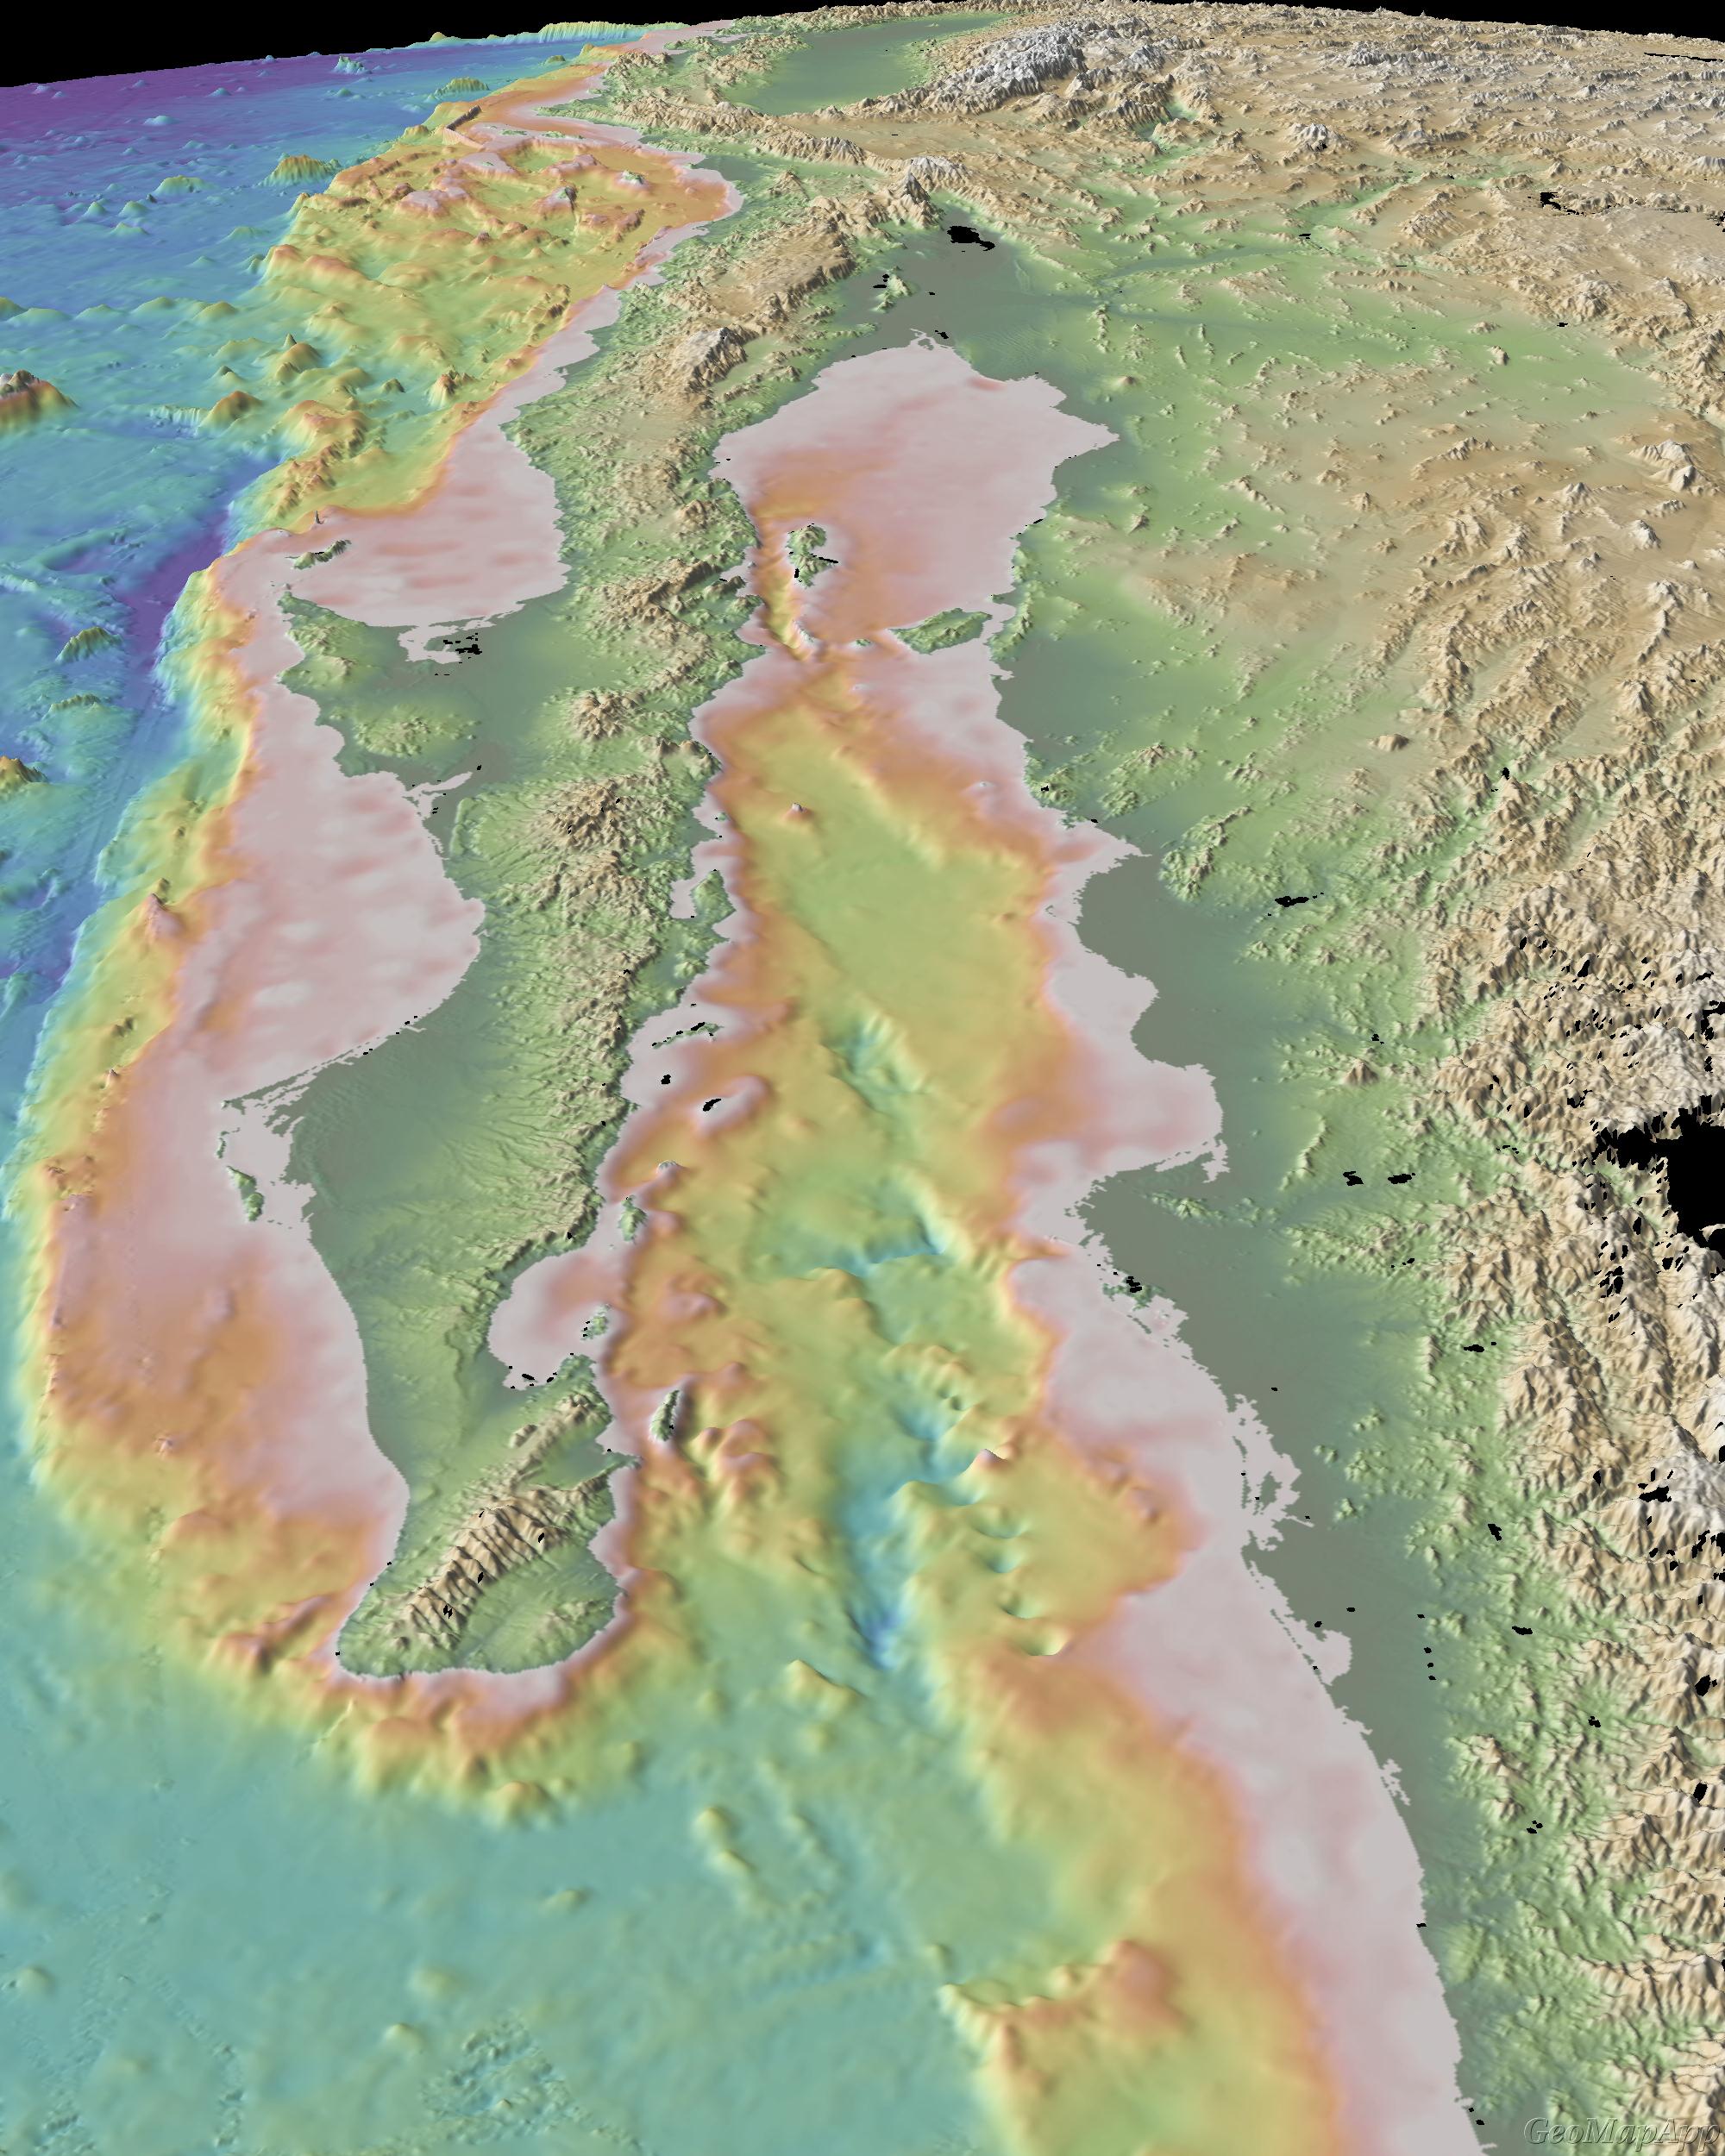
We are looking north with western North America on the right and the Pacific Ocean on the left. The bathymetry in the southern part of the Gulf of California beautifully shows the transition from the East Pacific Rise divergent plate boundary to the south (below the image) to the transform margin of the San Andreas system to the north, which runs right up the axis of the gulf.
~~~~~~~~~~~~~~~~~~~~~~~~~~~~~~~~~~~~~~~~~~~~~~~~~~~~~~~~~~~~~~~~~~~~~~~~~~~~~~~~~~
