Virtual Seismic Atlas

credit: Virtual Seismic Atlas (http://www.seismicatlas.org/)
Earlier this year I was informed about a fantastic new web resource for anyone interested in the geology of our planet beneath the surface (which should be everyone!). It’s called the Virtual Seismic Atlas (VSA):
The Virtual Seismic Atlas is an open access community resource to share the geological interpretation of seismic data. By browsing freely through the site you will find seismic images and interpretations. And you can down load higher resolution images for your use.
This is fantastic! Subsurface geologic data (especially in sedimentary basins) is intimately linked with the oil industry, which has resulted in a relative lack of information available to the public. If you start doing some digging there is a wealth of geophysical data out there that is available (e.g., see this USGS InfoBank page or this NOAA NGDC page). But you really need to be after something specific with databases like that … a certain geographic area or certain type of geophysical data. And you might need expensive software or specific technical knowledge to load/view those data. What the VSA does is provide a database of images showing examples of geologic features. I think it could be a fantastic resource for educators.
–
What exactly is seismic data?
To be more specific, it’s seismic-reflection data and it is currently our best tool for imaging the subsurface configuration of sedimentary basins (anywhere from 10s of m to 10 km depth). Sound waves travel down into the subsurface of the Earth and when they hit an interface between two rock/sediment types (and fluids play a role too) that have differing acoustic properties they reflect off that interface and travel back up to the surface where it is recorded. The result (after a lot of work processing the signal) is an image that more-or-less represents the subsurface architecture. There are some great web resources for learning more about the theory behind seismic data, its acquisition, and processing if you start searching around (e.g., here).
Even if you aren’t a hardcore geophysicist and don’t necessarily understand all the nuts-and-bolts of data acquisition and processing (e.g., me), you can still interpret the images.

credit: Virtual Seismic Atlas (http://www.seismicatlas.org/)
–
What kind of seismic images does VSA have?
The key to success of any online or virtual atlas is access to the information. I played around with the search capability using various keywords and the results were pretty good. Combined with the search function are these numerous categories and sub-categories:

These are essentially ‘tags’. You can see images by geography, data type, geologic age, and so on. For the ‘Depositional Architecture’ category I like how they use objective terms instead of other terms like “channel” that are thrown around willy-nilly and debated.

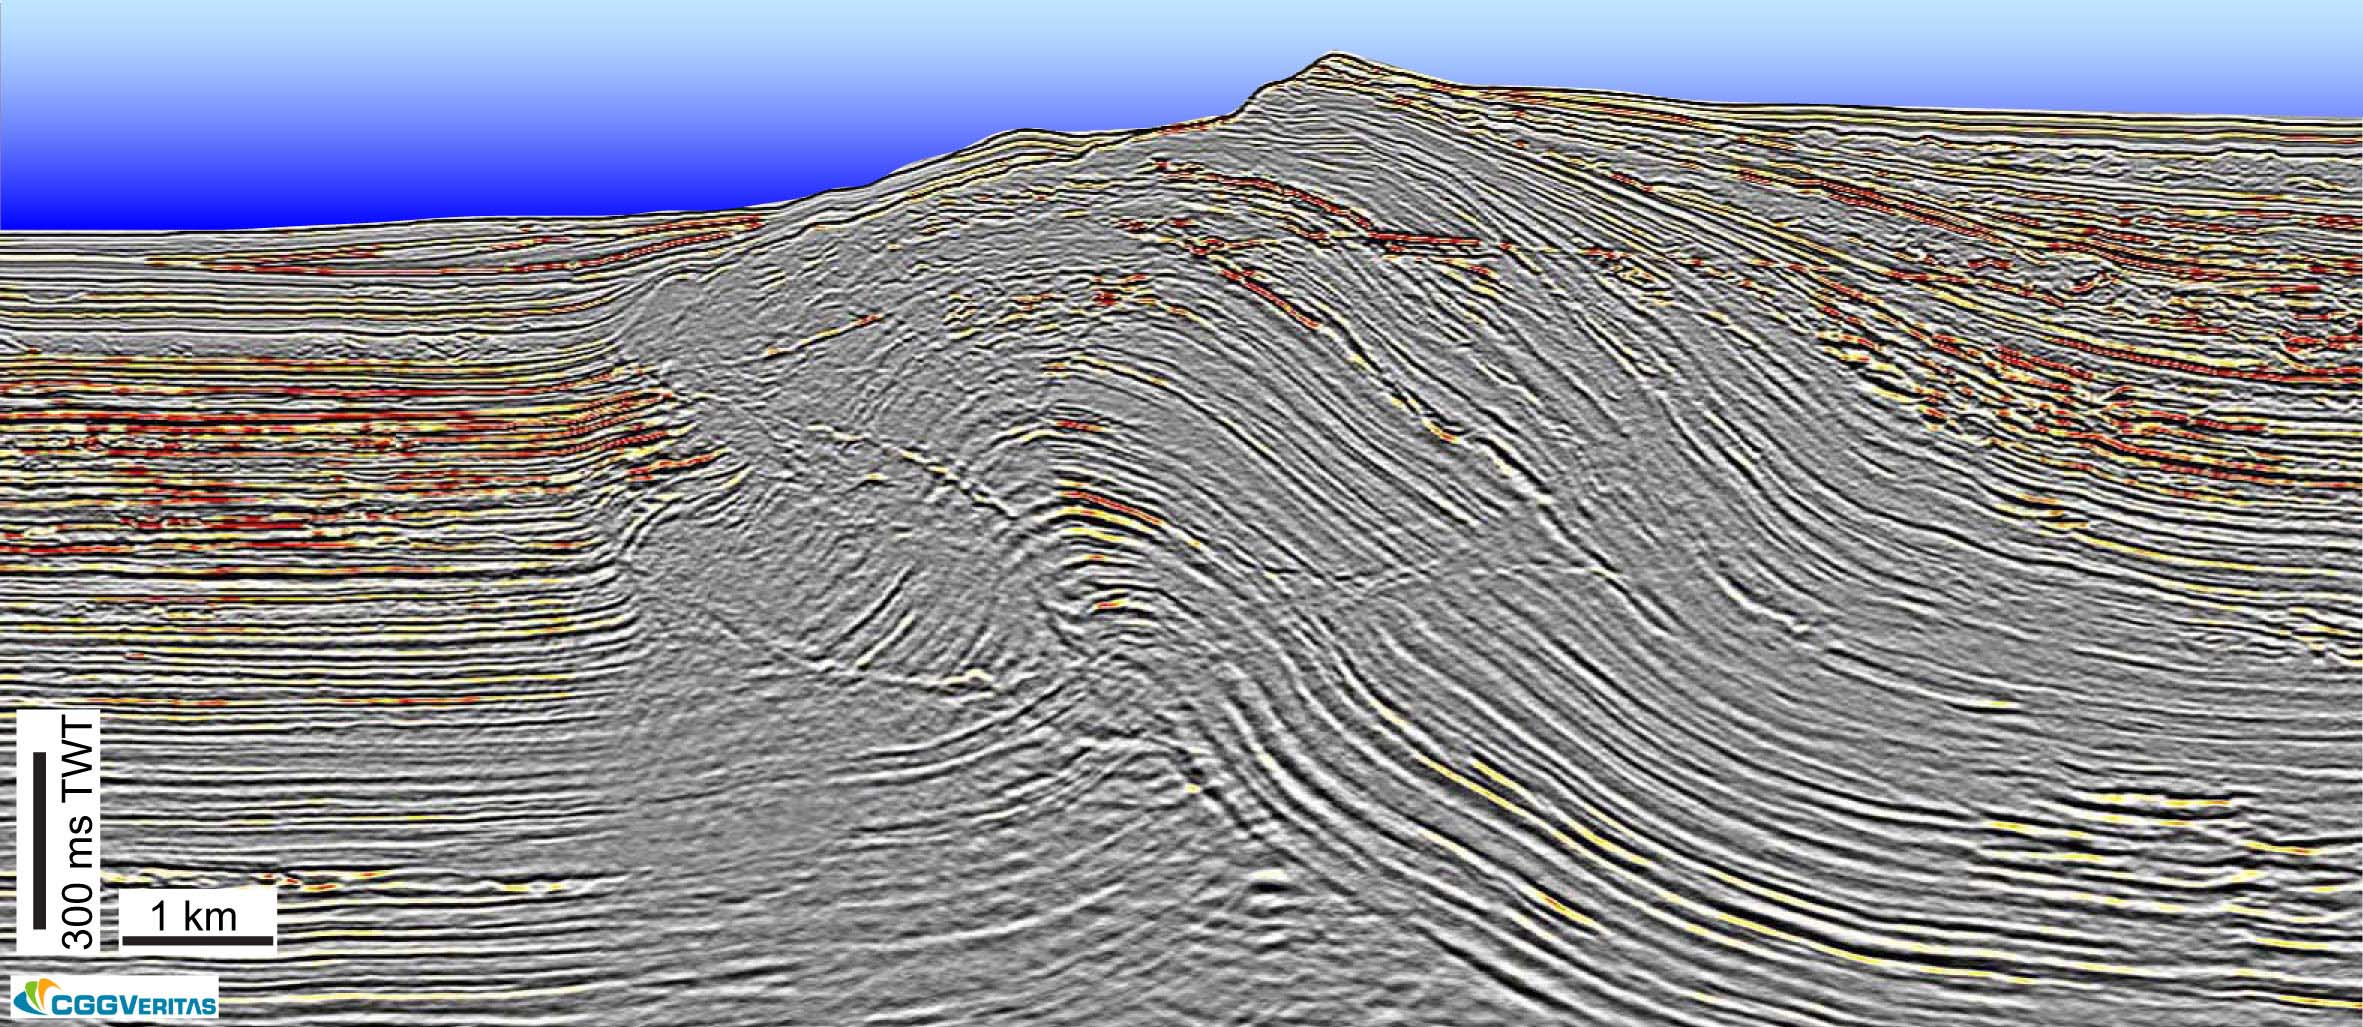
Calabrian accretionary prism, Ionian Sea -- credit: Virtual Seismic Atlas (http://www.seismicatlas.org)
The above image of the Calabrian accretionary wedge is one I came across just a few minutes ago while searching on the site (click on the image for a bigger version and then go here for more info from the VSA site). This particular image has some annotation on it, which is fantastic for teaching.
So, I recommend you go check out the Virtual Seismic Atlas and see what you can find. Have fun! I will definitely be using this resource for blog posts in the future.
–
Note: All images above are property of Virtual Seismic Atlas (VSA). They are available for personal or educational purposes, but please visit their site and read terms of use [pdf] before doing so.
~~~~~~~~~~~~~~~~~~~~~~~~~~~~~~~~~~~~~~~~~~~~~~~~~~
Photo in need of a caption
Okay … after nearly two years of blogging, I’m finally doing it.
That’s right, I’m blogging about my cats. I tried to hold out. Cat blogging is so pervasive, I never wanted to be a part of it, but I give up. Besides, science tells us about human behavior and cats.
Anyway … I think this photo could use a creative caption (click on it and zoom in a tad for full effect):

Any ideas?
~~~~~~~~~~~~~~~~~~~~~~~~~~~~~~~~~~~~~~~~~~~~~~~~~~
Friday Field Foto #63: Roadcut of Cretaceous strata near Morrison, Colorado
This week’s Friday Field Foto highlights a photo I took several years ago when I was working on my master’s in Colorado. A project for a clastic sedimentology class I was taking at the time required us to go visit a nearby roadcut outcrop, collect some data, and then synthesize our observations and interpretations.
This particular road cut is within the Cretaceous along the Front Range hogbacks (not too far from Denver).

Cretaceous Fox Hills Sandstone, Morrison, Colorado (© 2008 clasticdetritus.com)
The vertically-dipping yellowish rocks are sandstones and siltstones of the Fox Hills Sandstone (stratigraphic up is to the left). That is cut into by a very young alluvial surface with some gravel and reddish-brown sediment resting overlying the unconformity. And then there’s an anthropogenic unconformity on top of that with grayish/buff-colored fill from bulldozing activities (so we were told).
Check out this generalized cross section of the geology in this area.
Happy Friday!
~~~~~~~~~~~~~~~~~~~~~~~~~~~~~~~~~~~~~~~~~~~~~~~~~~
Fifty minerals meme
Dang, this particular meme is a strong one … nearly everybody else in geoblogosphere is doin’ it! So many that I’m not even going to link to them all (I’m lazy). Lounge of the Lab Lemming started it all (here). Additionally, Geology News has a word cloud summarizing the most popular from the various bloggers out there.
Here’s the deal: use bold to indicate minerals you’ve seen in the wild. Italics is for those seen in laboratories, museums, stores, or other non field locations. To be quite honest, after doing this little meme I’ve realized that I need to get out and look at more igneous and metamorphic rocks! I might have seen some of these in sedimentary rocks and don’t even know it … typical sedimentary geologist.
Andalucite
Apatite
Barite
Beryl
Biotite
Chromite
Chrysotile
Cordierite
Corundum
Diamond
Dolomite
Florencite
Galena
Garnet
Graphite
Gypsum
Halite
Hematite
Horneblende
Illite
Illmenite
Kaolinite
Kyanite
Lepidolite
Limonite
Magnetite
Molybdenite
Monazite
Nepheline
Olivine
Omphacite (is that real?)
Opal
Perovskite
Plagioclase
Pyrite
Quartz
Rutile
Sanidine
Sillimanite
Silver (native)
Sphalerite
Staurolite
Sulphur (native)
Talc
Tourmaline
Tremolite
Turquoise
Vermiculite
Willemite
Zeolite
Zircon
–
It’s quite possible I screwed something up in this list … I did it rather fast.
~~~~~~~~~~~~~~~~~~~~~~~~~~~~~~~~~~~~~~~~~~~~~~~~~~
Mystery graph – what is the data?
Okay … here’s a graph of data I collected. The axes aren’t labeled (as you can see).

What’s your guess?
UPDATE (9/9/08): Silver Fox wins (RCfon gets credit for guessing price of oil, which helped) — the above graph shows gasoline prices in the San Francisco Bay Area from May 2007 until now.
~~~~~~~~~~~~~~~~~~~~~~~~~~~~~~~~~~~~~~~~~~~~~~~~~~
Reminder: 2008 AGU Meeting abstracts due this Wednesday
 The deadline for submitting an abstract to the 2008 AGU meeting (Dec 15-19 in San Francisco, CA) is this Wednesday (September 10th). The annual meeting for the American Geophysical Union is the largest collection of Earth scientists in one spot every year.
A colleague and I are chairing a session that hopes to bring together both modelers and ‘observationalists’ of sedimentary systems into one session. It is a rather broad theme, so if your research is along these lines please consider submitting an abstract.
Here’s the session description from the AGU meeting website:
–
Natural and Experimental Depositional Landscapes and Stratigraphic Architecture: Bridging the Gap Between the Surface and Subsurface
This session aims to characterize net-depositional landscapes from natural systems and numerical/physical experiments in an effort to link surface form and process with the depositional record. Given the wide array of remote sensing techniques and available data sets, such as 3D seismic-reflection surveys, a primary objective is to discuss landscape evolution in both a forward and inverse sense. Forward-based research will focus on landscape geometry and kinematics with special emphasis on the linkages between the channel network structure, channel migration, and sediment routing, which are critical components for predicting the spatial distribution of deposition and erosion. Inverse-based research will focus on extracting time-integrated landscape evolution via the preserved depositional record (from subsurface and/or outcrop). Our hope is that overlap between forward and inverse methods, when layered on the broad range of spatial and temporal scales comprising the session, will provide a first step towards linking surface evolution under net-depositional conditions with patterns observed in the stratigraphic record.
–
You only have a couple days to get it in … get crackin’!!
~~~~~~~~~~~~~~~~~~~~~~~~~~~~~~~~~~~~~~~~~~~~~~~~~~
Sea-Floor Sunday #29: Laurentian Channel
For this week’s Sea-Floor Sunday image I sifted through my bookmarks and found this beautiful image highlighting the Laurentian Channel of the continental shelf area of the Atlantic margin of Canada.

credit: Natural Resources Canada (http://gsc.nrcan.gc.ca/coast/sealevel/evol/index_e.php)
Click on the map for a larger view and then go to this page from the Geological Survey of Canada (GSC) to see the original and more explanation of the features.
The coloring of this map nicely highlights the division between the relatively shallow continental shelf (light blues) and much deeper water to the southeast (dark blues).
The most prominent feature in this map is the Laurentian Channel, which is now a drowned glacial outwash river valley. During the Last Glacial Maximum (~20,000 yrs ago), the coastline and ice margin was out at the continental shelf edge.
As climate changed and the ice melted over the subsequent 10,000 yrs, the Laurentian Channel was the conduit for huge volumes of meltwater and sediment, much of which was transported off the shelf edge and into deep water. Check out this page from the same GSC website for some great illustrations of the evolution of this area as ice melted and sea levels rose.
~~~~~~~~~~~~~~~~~~~~~~~~~~~~~~~~~~~~~~~~~~~~~~~~~~
Friday Field Foto #62: Folded strata in the Canadian Rockies
A few weeks ago I had the opportunity to go on a field trip to see some Neoproterozoic turbidites in the Canadian Rockies (see this post). While the detailed sedimentologic and stratigraphic work is being done on a relatively undeformed section, the mountains in this region are chock full of folded and faulted strata. I thought this one was particularly spectacular.

Folded and faulted Neoproterozoic strata, Canadian Rockies (© 2008 clasticdetritus.com)
Okay, all you structural geology geeks … what are we looking at? Give me some wildly comprehensive interpretations based on this one photo.
~~~~~~~~~~~~~~~~~~~~~~~~~~~~~~~~~~~~~~~~~~~~~~~~~~
This week’s Sea-Floor Sunday image is historical. A few months ago I stumbled upon the NOAA Photo Library, which contains a wealth of
The map below (from this page on the NOAA Photo Library site) is a bathymetric map of the continental shelf and uppermost slope off shore of Long Island, NY and New Jersey.
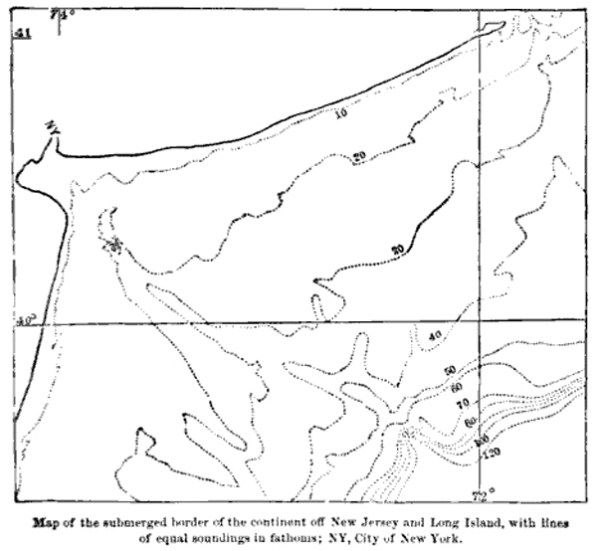
credit: NOAA Photo Library
New York City is denoted by the ‘NY’ in the upper left. The contours are in fathoms (1 m = 0.55 fathoms) and nicely shows the Hudson Shelf Valley, which is the course of the Hudson River when sea levels were 130 m lower during the Last Glacial Maximum (~20,000 yrs ago).
Here’s the blurb about this map quoted directly from the NOAA archive site:
A map of Hudson Canyon reproduced in James Dwight Dana’s Manual of Geology, first edition, published in 1862. This map was provided by the United States Coast Survey to Dana. The first discovery of submarine canyons occurred on the Pacific Coast, Hueneme Canyon in 1855 and Monterey Canyon in 1857.
That’s awesome! How did they make such a map in 1862? I don’t know the details of this particular cruise, but back in those days they essentially made measurements of bottom elevation by lowering hand lines down (echo soundings did not come around for another few decades).
Regarding the west coast submarine canyons mentioned in that description, I have actually done some work on the submarine fan that Hueneme Canyon feeds, which I’ll post about soon, and I’ve already posted about Monterey canyon and fan system here, here, and here.
Compare the 1862 map to this modern multibeam bathymetric map below that I’ve posted about before.
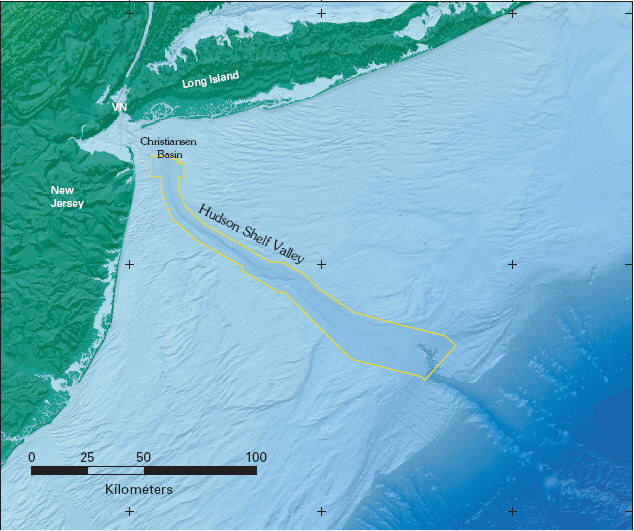
credit: USGS
The NOAA Photo Library has so much to explore, you should check it out … here’s a summary directly from their site:
• More than 10,000 new images.
• New search capability.
• Many new albums that better reflect NOAA’s stewardship role and range of operations.
• Hundreds of Hurricane Katrina images that help record the extent of damage of this American tragedy.
• Thousands of stunning ocean exploration photographs, coral reef photographs, and polar regions photographs.
• New additions to albums including remarkable lightning photography, coastal photographs detailing the nooks and crannies of our American coastline including a medley of American lighthouses, and new images detailing the Treasures of the NOAA Library.
• And in this, the 200th Anniversary of the Coast Survey, NOAA’s oldest ancestor agency and America’s first science agency, thousands of newly digitized historical photographs detailing the work of the Coast Survey, Fisheries Commission and Weather Bureau.
~~~~~~~~~~~~~~~~~~~~~~~~~~~~~~~~~~~~~~~~~~~~~~~~~~
