Sea-Floor Sunday #28: Bathymetric map of Hudson shelf valley from 1862
This week’s Sea-Floor Sunday image is historical. A few months ago I stumbled upon the NOAA Photo Library, which contains a wealth of
The map below (from this page on the NOAA Photo Library site) is a bathymetric map of the continental shelf and uppermost slope off shore of Long Island, NY and New Jersey.
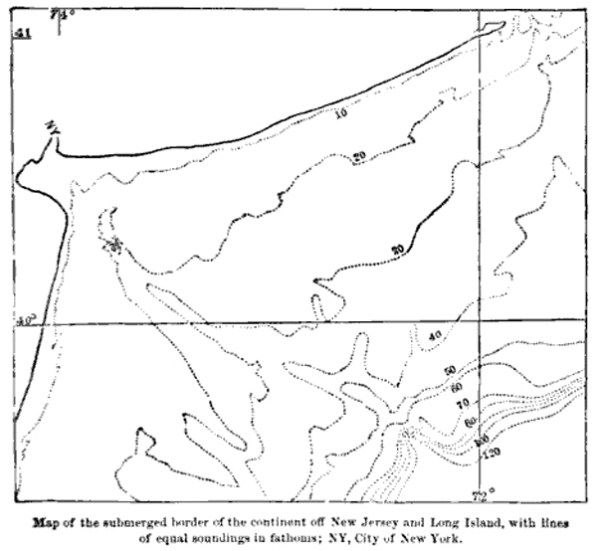
credit: NOAA Photo Library
New York City is denoted by the ‘NY’ in the upper left. The contours are in fathoms (1 m = 0.55 fathoms) and nicely shows the Hudson Shelf Valley, which is the course of the Hudson River when sea levels were 130 m lower during the Last Glacial Maximum (~20,000 yrs ago).
Here’s the blurb about this map quoted directly from the NOAA archive site:
A map of Hudson Canyon reproduced in James Dwight Dana’s Manual of Geology, first edition, published in 1862. This map was provided by the United States Coast Survey to Dana. The first discovery of submarine canyons occurred on the Pacific Coast, Hueneme Canyon in 1855 and Monterey Canyon in 1857.
That’s awesome! How did they make such a map in 1862? I don’t know the details of this particular cruise, but back in those days they essentially made measurements of bottom elevation by lowering hand lines down (echo soundings did not come around for another few decades).
Regarding the west coast submarine canyons mentioned in that description, I have actually done some work on the submarine fan that Hueneme Canyon feeds, which I’ll post about soon, and I’ve already posted about Monterey canyon and fan system here, here, and here.
Compare the 1862 map to this modern multibeam bathymetric map below that I’ve posted about before.
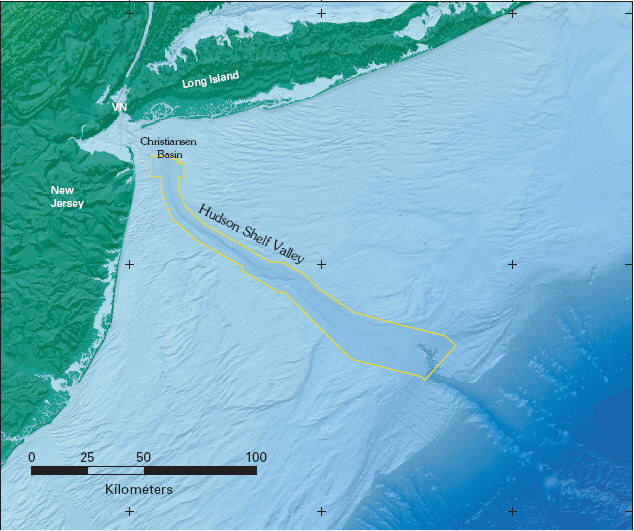
credit: USGS
The NOAA Photo Library has so much to explore, you should check it out … here’s a summary directly from their site:
• More than 10,000 new images.
• New search capability.
• Many new albums that better reflect NOAA’s stewardship role and range of operations.
• Hundreds of Hurricane Katrina images that help record the extent of damage of this American tragedy.
• Thousands of stunning ocean exploration photographs, coral reef photographs, and polar regions photographs.
• New additions to albums including remarkable lightning photography, coastal photographs detailing the nooks and crannies of our American coastline including a medley of American lighthouses, and new images detailing the Treasures of the NOAA Library.
• And in this, the 200th Anniversary of the Coast Survey, NOAA’s oldest ancestor agency and America’s first science agency, thousands of newly digitized historical photographs detailing the work of the Coast Survey, Fisheries Commission and Weather Bureau.
~~~~~~~~~~~~~~~~~~~~~~~~~~~~~~~~~~~~~~~~~~~~~~~~~~

Small correction… your fathoms to meters are reversed.
Ryan … nice catch … fixed. Thanks.
Thank you for the link to NOAA’s gallery. I was at their site yesterday looking for info on Gustav, and I missed this, because I’m a dope.hehe They have a fantastic video of the movement of Dolly and some other storm, sped up to show the big picture concerning air movement and such. I can’t wait to dive in for more! Don’t worry…I haven’t eaten a cheeto in 30 minutes.