Friday Field Foto #72: Meandering river in Patagonia
Real quick Friday Field Foto today … busy, busy.
This is one of my favorite photos in my collection. I like the way the light is reflecting off the river.

Rio de las Chinas, Ultima Esperanza, southern Chile (© 2008 clasticdetritus.com)
We climbed up this ridge (note people on right side of photo) to get a look at the siltstone and shale exposed in the gulley, which is mostly out of view. I think we spent more time enjoying the view of this beautiful meandering river down in the valley instead of looking at the rocks.
~~~~~~~~~~~~~~~~~~~~~~~~~~~~~~~~~~~~~~~~~~~~~~~~~~
Fun with Flickr
I’ve had some photographs on Flickr for over a year now. I haven’t really done too much with the account besides upload a handful of photos every once in a while. This past weekend I finally spent a bit of time and played around with their map functionality.
To see some photos of Patagonia (that you’ve probably seen before in a Friday Field Foto) go here or click on the screenshot below.

You can also see some of my photos from around the San Francisco Bay Area — go here or click on the screenshot below.

I think Flickr’s map function still needs a bit of work. For example, I wish I could save different map views such that a viewer could pick from a dropdown list — some might be regional in scale, some might be very zoomed in. Right now you have to zoom in to different areas and then the photos that are within that area will show up in the strip along the bottom.
Once the photos are ‘geotagged’ in Flickr there are probably tons of tricks and tips for making other geographic visualizations (e.g., GoogleEarth?). I’m sure some of you know much more about this than me … feel free to leave a comment below.
Of course, you can find photos other ways too … I’ve been pretty good about adding tags to my photos as I upload them. Click on the screenshot below to go to my tag page and explore that way.

At some point, it would be great to get all my photos of sedimentary structures and other geologic features in there. Just need to find the time.
~~~~~~~~~~~~~~~~~~~~~~~~~~~~~~~~~~~~~~~~~~~~~~~~~~
Subduction references
Note: this post is a reference post for the ‘subduction denialism’ series of posts — for context, see Parts 1, 2, and 3.
–
Individual papers/articles related to subduction:
Stern, R.J., 2002, Subduction zones: Reviews of Geophysics, v. 40, 1012, doi: 10.1029/2001RG000108.
Tatsumi, Y. 2005. The Subduction Factory: How it operates on Earth. GSA Today, v. 15, No. 7, 4-10.
Abers, G. A., Hydrated subducted crust at 100–250 km depth, Earth Planet. Sci. Lett., 176, 323–330, 2000.
Allmendinger, R. W., T. E. Jordan, S. M. Kay, and B. L. Isacks, The evolution of the Altiplano-Puna Plateau of the central Andes, Annu. Rev. Earth Planet. Sci., 25, 139–174, 1997.
Ayers, J. C., S. K. Dittmer, and G. D. Layne, Partitioning of elements between peridotite and H2O at 2.0–3.0 GPa and 900–1100 C, and application to models of subduction zone processes, Earth Planet. Sci. Lett., 150, 381–398, 1997.
Bevis, M., et al., Geodetic observations of very rapid convergence and back-arc extension at the Tonga arc, Nature, 374, 249–251, 1995.
Bevis, M., E. Kendrick, R. Smalley Jr., B. Brooks, R. Allmendinger and B. Isacks, On the strength of interplate coupling and the rate of back arc convergence in the central Andes: An analysis of the interseismic velocity field, Geochem. Geophys. Geosyst., 2, 2001GC000198, 2001.
Billen, M. I., and M. Gurnis, A low viscosity wedge in subduction zones, Earth Planet. Sci. Lett., 193, 227–236, 2001.
Chiu, J.-M., B. L. Isaaks, and R. K. Cardwell, 3-D configuration of subducted lithosphere in the western Pacific, Geophys. J. Int., 106, 99–111, 1991.
Cloos, M., Lithospheric buoyancy and collisional orogenesis: Subduction of oceanic plateaus, continental margins, island arcs, spreading ridges, and seamounts, Geol. Soc. Am. Bull., 105, 715–737, 1993.
Collier, J. D., G. R. Helffrich, and B. J. Wood, Seismic discontinuities and subduction zones, Phys. Earth Planet. Inter., 127, 35–49, 2001.
Dahlen, F. A., Critical taper model of fold-and-thrust belts and accretionary wedges, Annu. Rev. Earth Planet. Sci., 18, 55– 99, 1990.
d’Ars, J. B., C. Jaupart, and R. S. J. Sparks, Distribution of volcanoes in active margins, J. Geophys. Res., 100(B10), 20,421–20,432, 1995.
Davies, G. F., On the emergence of plate tectonics, Geology, 20, 963–966, 1992.
Davies, G. F., Penetration of plates and plumes through the mantle transition zone, Earth Planet. Sci. Lett., 133, 507– 516, 1995.
Davies, J. H., The role of hydraulic fractures and intermediatedepth earthquakes in generating subduction-zone magmatism, Nature, 398, 142–145, 1999.
DeBari, S. M., Evolution of magmas in continental and oceanic arcs: The role of the lower crust, Can. Mineral., 35, 501–519, 1997.
Ducea, M., Constraints on the bulk composition and root foundering rates of continental arcs: A California arc perspective, J. Geophys. Res., 107(B11), 2304, doi:10.1029/ 2001JB000643, 2002.
Eiler, J. M., A. Crawford, T. Elliott, K. A. Farley, J. W. Valley, and E. M. Stolper, Oxygen isotope geochemistry of oceanicarc lavas, J. Petrol., 41, 229–256, 2000.
Elliott, T., T. Plank, A. Zindler, W. White, and B. Bourdon, Element transport from slab to volcanic front at the Mariana arc, J. Geophys. Res., 102(B7), 14,991–15,019, 1997.
Forsyth, D., and S. Uyeda, On the relative importance of the driving forces of plate motions, Geophys. J. R. Astron. Soc., 43, 163–200, 1975.
Fryer, P., J. P. Lockwood, N. Becker, S. Phipps, and C. S. Todd, Significance of serpentine mud volcanism in convergent margins, in Ophiolites and Oceanic Crust, edited by Y. Dilek et al., Spec. Pap. Geol. Soc. Am., 349, 35–51, 2000.
Gaetani, G., and T. L. Grove, The influence of water on melting of mantle peridotite, Contrib. Mineral. Petrol., 131, 323–346, 1998.
Grellet, C., and J. Dubois, The depth of trenches as a function of the subduction rate and age of the lithosphere, Tectonophysics, 82, 45–56, 1982.
Haberland, C., and A. Rietbock, Attenuation tomography in the western central Andes: A detailed insight into the structure of a magmatic arc, J. Geophys. Res., 106(B6), 11,151–11,167, 2001.
Hawkesworth, C. J., K. Gallagher, J. M. Hergt, and F. McDermott, Mantle and slab contributions in arc magmas, Annu. Rev. Earth Planet. Sci., 21, 175–204, 1993.
Hawkesworth, C. J., S. P. Turner, F. McDermott, D. W. Peate, and P. van Calstern, U-Th isotopes in arc magmas: Implications for element transfer from the subducted crust, Science, 276, 551–555, 1997.
Hilde, T. C., Sediment subduction versus accretion around the Pacific, Tectonophysics, 99, 381–397, 1983.
Holbrook, W. S., D. Lizarralde, S. McGeary, N. Bangs, and J. Deibold, Structure and composition of the Aleutian island arc and implications for continental crustal growth, Geology, 27, 31–34, 1999.
Hyndman, R. D., M. Yamano, and D. A. Oleskevich, The seismogenic zone of subduction thrust faults, Isl. Arc, 6(3), 244–260, 1997.
Irifune, T., Phase transformations in the Earth’s mantle and subducting slabs: Implications for their compositions, seismic velocity and density structures and dynamics, Isl. Arc, 2, 55–71, 1993.
Iwamori, H., Transportation of H2O and melting in subduction zones, Earth Planet. Sci. Lett., 160, 65–80, 1998.
Johnson, M. C., and T. Plank, Dehydration and melting experiments constrain the fate of subducted sediments, Geochem. Geophys. Geosyst., 1, 199GC000014, 1999.
Ka´rason, H., and van der Hilst, R. D., Constraints on mantle convection from seismic tomography, in The History and Dynamics of Global Plate Motion, Geophys. Monogr. Ser., vol. 121, edited by M. A. Richards, R. Gordon, and R. D. van der Hilst, pp. 277–288, AGU, Washington, D. C., 2000.
Kay, R. W., Aleutian magnesian andesites; Melts from subducted Pacific Ocean crust, J. Volcanol. Geotherm. Res., 4, 117–132, 1978.
Kent, A. J. R., and T. R. Elliott, Melt inclusions from Marianas arc lavas: Implications for the composition and formation of island arc magmas, Chem. Geol., 183, 263–286, 2002.
Kerrick, D. M., and J. A. D. Connolly, Metamorphic devolatilization of subducted marine sediments and the transport of volatiles into the Earth’s mantle, Nature, 411, 293–296, 2001a.
Kincaid, C., and I. S. Sacks, Thermal and dynamical evolution of the upper mantle in subduction zones, J. Geophys. Res., 102(B6), 12,295–12,315, 1997.
Kirby, S. H., W. B. Durham, and L. A. Stern, Mantle phase changes and deep-earthquake faulting in subducting lithosphere, Science, 252, 216–225, 1991.
Kirby, S. H., S. Stein, E. A. Okal, and D. C. Rubie, Metastable mantle phase transformations and deep earthquakes in subducting oceanic lithosphere, Rev. Geophys., 34, 261–306, 1996.
Maekawa, H., M. Shozuni, T. Ishii, P. Fryer, and J. A. Pearce, Blueschist metamorphism in an active subduction zone, Nature, 364, 520–523, 1993.
McCaffrey, R., Global variability in subduction thrust zoneforearc systems, Pure Appl. Geophys., 142, 173–224, 1994.
Miller, D. J., and N. I. Christensen, Seismic signature and geochemistry of an island arc; A multidisciplinary study of the Kohistan accreted terrane, northern Pakistan, J. Geophys. Res., 99(B6), 11,623–11,642, 1994.
Molnar, P., D. Freedman, and J. S. F. Shih, Lengths of intermediate and deep seismic zones and temperatures in downgoing slabs of lithosphere, Geophys. J. R. Astron. Soc., 56, 41–54, 1979.
Mottl, M. J., Pore waters from serpentinite seamounts in the Mariana and Izu-Bonin forearcs, Leg 125: Evidence for volatiles from the subducting slab, Proc. Ocean Drill. Program Sci. Results, 125, 373–385, 1992.
O’Brien, P. J., Subduction followed by collision: Alpine and Himalayan examples, Phys. Earth Planet. Inter., 127, 277– 291, 2001.
Pacheco, J. F., L. R. Sykes, and C. H. Scholz, Nature of seismic coupling along simple plate boundaries of the subduction type, J. Geophys. Res., 98, 14,133–14,159, 1993.
Pawley, A. R., and J. R. Holloway, Water sources for subduction zone volcanism: New experimental constraints, Science, 260, 664–667, 1993.
Peacock, S. M., Are the lower planes of double seismic zones caused by serpentine dehydration in subduction oceanic mantle?, Geology, 29, 299–302, 2001.
Peacock, S. M., Thermal structure and metamorphic evolution of subducting slabs, in Geophysical Monograph Series, edited by J. Eiler and G. A. Abers, AGU, Washington, D. C., 2002.
Peate, D. W., J. A. Pearce, C. J. Hawkesworth, H. Colley, C. M. H. Edwards, and K. Hirose, Geochemical variations in Vanuatu Arc lavas: The role of subducted material and a variable mantle wedge composition, J. Petrol., 38, 1331– 1358, 1997.
Plank, T., and C. H. Langmuir, Tracing trace elements from sediment input to volcanic output at subduction zones, Nature, 362, 739–742, 1993.
Plank, T., and C. Langmuir, The chemical composition of subducting sediment and its consequence for the crust and mantle, Chem. Geol., 145, 325–394, 1998.
Ruff, L. J., and H. Kanamori, Seismicity and the subduction process, Phys. Earth Planet. Inter., 23, 240–252, 1980.
Ruff, L. J., and B. W. Tichelaar, What controls the seismogenic plate interface in subduction zones?, Subduction: Top to Bottom, Geophys. Monogr. Ser., vol. 96, edited by G. E. Bebout et al., pp. 105–111, AGU, Washington D. C., 1996.
Sano, Y., and S. N. Williams, Fluxes of mantle and subducted carbon along convergent plate boundaries, Geophys. Res. Lett., 23, 2749–2752, 1996.
Scambelluri, M., and P. Philippot, Deep fluids in subduction zones, Lithos, 55, 213–227, 2001.
Sobolev, A. V., and M. Chaussidon, H2O concentrations in primary melts from supra-subduction zones and mid-ocean ridges: Implications for H2O storage and recycling in the mantle, Earth Planet. Sci. Lett., 137, 45–55, 1996.
Stern, R. J., and N. C. Smoot, A bathymetric overview of the Mariana forearc, Isl. Arc, 7, 525–540, 1998.
Stolper, E., and S. Newman, The role of water in the petrogenesis of Mariana Trough magmas, Earth Planet. Sci. Lett., 121, 293–325, 1994.
Tichelaar, B. W., and L. J. Ruff, Depth of seismic coupling along subduction zones, J. Geophys. Res., 98(B2), 2017– 2037, 1993.
Ulmer, P., and V. Trommsdorf, Serpentine stability to mantle depths and subduction-related magmatism, Science, 268, 858–861, 1995.
van Keken, P. E., B. Kiefer, and S. M. Peacock, High-resolution models of subduction zones: Implications for mineral dehydration reactions and the transport of water into the deep mantle, Geochem. Geophys. Geosyst., 3(10), 1056, doi: 10.1029/2001GC000256, 2002.
White, D. A., D. H. Roeder, T. H. Nelson, and J. C. Crowell, Subduction, Geol. Soc. Am., 81, 3431–3432, 1970.
Yuan, X., et al., Subduction and collision processes in the central Andes constrained by converted seismic phases, Nature, 408, 958–961, 2000.
Zhao, D., New advances of seismic tomography and its applications to subduction zones and earthquake fault zones, Isl. Arc, 10, 68–84, 2001.
Zhao, D., A. Hasegawa, and H. Kanamori, Deep structure of Japan subduction zone as derived from local, regional, and teleseismic events, J. Geophys. Res., 99(B11), 22,313 22,329, 1994.
–
Textbooks and other reference books for general plate tectonics:
Global Tectonics, P. Keary and F. J. Vine (2nd Ed.), Blackwell, 1996.
Plate Tectonics, Cox and Hart, Allen & Unwin, Boston, MA, 1986.
Dynamic Earth: Plates, Plumes and Mantle Convection, Davies, G. F., Cambridge University Press, 1999.
Tatsumi, Y., and S. Eggins, Subduction Zone Magmatism, Blackwell, Malden, Mass., 1995.
Taylor, S. R., and S. M. Mclennan, The Continental Crust: Its Composition and Evolution, Blackwell Sci., Malden, Mass., 1985.
Yeats, R. S., K. Sieh, and C. R. Allen, The Geology of Earthquakes, Oxford Univ. Press, New York, 1997.
Busby & Ingersoll, Tectonics of Sedimentary Basins, Blackwell, 1996.
–
Subduction zone-related websites:
MARGINS subduction factory: http://www.ldeo.columbia.edu/margins/SubFac.html
MARGINS seismogenic zone: http://www.ldeo.columbia.edu/margins/SeismZone.html
Geochemical Earth Reference Models: http://www.earthref.org/GERM/main.htm
Geochemistry of rocks of the oceans and continents: http://georoc.mpch-mainz.gwdg.de/
Volcano world: http://volcano.und.nodak.edu/vw.html
Global Volcanism Program: http://www.nmnh.si.edu/gvp/
Three-dimensional representation of subduction zones: http://piru.alexandria.ucsb.edu/collections/kirkby_morin/gdyn/main.html
U.S. Geological Survey “Dynamic Earth”: http://pubs.usgs.gov/publications/text/dynamic.html
Note: This post is the third in a three-part series — please see Part 1 and Part 2 from earlier today before continuing — you’ll need the context. The numbering of the figures in this post continues from Part 2.
–
Geophysical Imaging of the Cascadia Continental Margin
Let’s get back to the Cascadia region — if you need a refresher of the area, go back to Part 2 and look at Fig. 1a for the regional bathymetric/topographic map of this continental margin. The seismic-reflection data shown below (from Calvert, 2004) is from the northern part of this region, near Vancouver Island.

Fig. 15: (a) Unmigrated seismic-reflection cross section and (b) migrated section superimposed on P-wave velocities of Cascadia margin; black circles are earthquakes (from Fig. 2 of Calvert, 2004; Nature, 428, p. 163-167)
Click on it for a bigger and less fuzzy version. Calvert interprets the package of higher amplitude reflectors (darker color) as the underthrusting Juan de Fuca plate. Earthquakes, shown by the black dots, along with the P-wave velocity structure shown in color are depicted with the reflection profile in the lower figure.
A USGS study from 1999 by Stanley et al. investigates crustal-scale structure of this region to evaluate models of deformation as they relate to earthquakes (this one is an Open File report that can be found here).

Fig. 16: Stanley et al., 1999; USGS Open File Report: http://pubs.usgs.gov/of/1999/ofr-99-0311/
The profile above (one of many transects shown in report) is again showing the seismic wave velocity structure across this continental margin.
The two illustrations above are just a couple of many crustal-scale studies of the Cascadia region (see references within each for more). Now, let’s zoom in a bit on the accretionary complex.

Fig. 17: Bathymetric map of Cascadia margin (created in GeoMapApp)
I didn’t put annotation on the map above on purpose, no interpretation, no arrows, nothing — this is the physiography of this margin, plain and simple. The region in the reddish-orange to yellow-green colors marks the boundary between the oceanic Juan de Fuca plate (to the west) and the continental North American plate (to the east).
–
Sedimentation History of Cascadia Convergent Margin
A great paper on the evolution of the Cascadia margin is a 1978 paper from Barnard in Marine Geology. The paper presents numerous seismic-reflection profiles that were acquired across the continental slope — the image below is just one of the many in the paper.

Fig. 18: Seismic-reflection profile of Cascadia margin (from Barnard, 1978; Marine Geology, v. 27)
You definitely want to click on this one to see the details. This profile is essentially at the latitude of the Columbia River mouth, which is the large east-west trending estuary near the upper-right corner of the map in Fig. 17. Note the ridge and basin topography. The reflectors in the ridges are concave-down suggesting incremental uplift and folding of older strata. The areas between the ridges are relatively flat with horizontal to slightly inclined reflectors that ‘onlap’ the basin margins indicating that sediment as filled in these basins.
The next image below, which I’ve shown before in the Sea-Floor Sunday series, shows this ridge and basin topography very clearly.

Fig. 19: Perspective bathymetric image looking southeast of Cascadia margin (from Pratson & Haxby, 1996; Geology, v. 24)
Also note the submarine fan that has developed (near the bottom of the image) outboard of the deformation front. It has a beautiful fan valley/channel that connects back to the shelf area, which is consistent with previous observations mentioned above regarding terrigenous sediment being transported across the accretionary wedge and out onto the Juan de Fuca plate. If you look back up at the bathymetric map in Fig. 17, you can see this submarine fan and the submarine canyon that fed it.
Underwood & Moore (1995) synthesize the history and magnitude of sedimentation in the Cascadia region:
…the continental margin of Oregon and Washington has several impressive submarine canyons. Barnard (1978) calculated the late Pleistocene sediment volume for Cascadia Basin (seaward of the deformation front) and compared that value with estimated volume for the Washington slope; he concluded that roughly two-thirds of the sediment delivered to the shelf edge bypasses the slope completely through the dominant submarine canyons.
In other words, two-thirds of the continentally-derived sediment makes it beyond the continental slope (where those trench-slope basins shown in Barnard’s seismic-reflection profiles shown in Fig. 18 are).
Underwood & Moore (1995) continue:
Rates of turbidite accumulation within Cascadia Basin have been exceptionally high (Kulm et al., 1973), particularly during lowstands. The most important features are the Nitinat and Astoria fans, and the Vancouver and Cascadia channels … The basin floor is unusually shallow (2,400-3,000 m) because the subducting oceanic crust (generated by sea-floor spreading along the nearby Gorda/Juan de Fuca Ridge system) is young, warm, and buoyant; the rate of plate convergence is also relatively slow. As a consequence, the trench is completely obscured as a bathymetric feature.
Emphasis mine. They go on to discuss more details of component depositional systems, their respective thicknesses, histories, and relationships to the coastal staging areas in that review paper.
So, why is there so much sediment being transported to and deposited along the Cascadia margin? The size of the Columbia River drainage basin is a major factor. While many continental arc margins have numerous and high sediment-flux rivers along there length, few have rivers the size of the Columbia. It is the largest river flowing into the Pacific Ocean from North America (as measured by volume of flow). Big rivers generally deliver a lot of sediment.

Fig. 20: Map showing Columbia River watershed (credit: http://en.wikipedia.org/wiki/Image:Columbiarivermap.png)
By contrast, if you look at a map of Peru and Chile (another oceanic-continental convergent margin) you’ll notice that the continental divide runs down the spine of the Andes Mountains, which is pretty close to the plate boundary. The Columbia River watershed reaches ~900 km back into the North American continent from the plate boundary. The headwaters for rivers that flow from the Andes into the Pacific Ocean, however, are generally 200-300 km from the plate boundary. But it’s not just distance — the Columbia River drainage basin area is huge and has several large tributaries. While the river systems coming off the Andes may have high sediment flux locally, they are numerous and are spread across the orogen.
If you go back up and look at the map in Fig. 17 you’ll notice that the mouth of the Columbia River is not very close to the continental slope. Remember that the last million years or so has fluctuated between ice ages and ‘interglacials’ — sea levels were >100 m lower than they are today just 18,000 years ago in the latest Pleistocene. The lower sea level pushes the shoreline out to the modern continental shelf edge. In other words, the mouth of the Columbia River emptied directly into (and helped create) the submarine canyon head you see near the continental shelf edge.
A great paper by Normark and Reid (2003) discusses Pleistocene-aged turbidite deposits in the greater Cascadia region. You have most likely heard about those famous catastrophic late Pleistocene mega-floods that created the Channeled Scablands. What happened when these mega-floods reached the sea?

Fig. 21: Map showing extent of Pleistocene terrigenous deposition on the Juan de Fuca and Pacific plates (credit: Fig. 12 from Normark & Reid, 2003; The Journal of Geology, v. 111)
The map above summarizes the extent of turbidite sediments showing them nearly 1000 km (!) to the west, beyond the Blanco Fracture Zone, and on the Pacific Plate. The inset diagram in the lower left (click on it to see bigger version) shows the volumes for the initial outburst flood. Normark & Reid also show an ODP core in Escanaba Trough has a >300 m thick section of turbidites that have been deposited since ~30,000 years ago. The details and implications of this paper are endlessly fascinating (to me), so I’ll save a more thorough discussion of it for another time. But what’s important to reiterate for this post is that the Cascadia region has received ridiculous amounts of sediment in recent geologic history.
–
Concluding Remarks
This series of posts is in no way a comprehensive review of subduction — it is not a comprehensive review of the Cascadia example. It is not even a comprehensive review of sedimentation in the Cascadia region for the Pleistocene. Although these posts are lengthy as blog posts go, I’m barely scratching the surface.
One of the last comments from Anaconda in that long exchange was:
Why is it so hard for you to admit a harmless mistake (jumping to the conclusion that Cascadia has a “trench overfilled w/ sediment”), or that subduction theory has weaknesses for that matter?
First of all, I hope that this series of posts demonstrates that I did not “jump to a conclusion” regarding Cascadia’s history of sedimentation. If my summary of the numerous studies doesn’t convince you, then I encourage you to look at the specific studies and evaluate them yourself.
Secondly, I have no problem discussing the uncertainties with respect to subduction — obviously there is a lot we don’t know. But, Anaconda is talking about “weaknesses” in the entire concept … as in weaknesses compared to a model of the Earth that has no subduction. This is confusing logic (at least to me) … the subduction denialists must, at some point, explain the physiography of plate boundaries within the context of their conceptual model of the Earth. They can try and debunk plate tectonics theory all they want … be my guest … but that won’t create a paradigm shift or revolution in thinking. That will only happen when a comprehensive and integrated model (with data and observations from all over the Earth) is presented, tested, and evaluated by others. If they want to resurrect geosynclinal theory for the formation of orogenic belts — go for it. But do it with data and do it systematically. Broad assertions don’t cut it.
Of course they will shout back “No, the burden of proof is on you!”. And then when I point them to either a single paper, several papers, or nearly 70 papers and several textbooks full of thousands of references from several decades of research, they’ll rebut “Don’t give me a laundry list! If you can’t convince me in your own words, you fail!” or something like that. And then, of course, there will be a rebuttal that discusses dogma, history/philosophy of science, other meta-science arguments, persecution from the ivory tower, or even conspiracy theories that, in my opinion, simply evade actually doing any real research.
I’ve been called arrogant and disgrace to my profession by Anaconda before (really) … and before that, when I attempted to have a civil discussion, he accused me or “trying to appear reasonable”. So, I think it’s safe to assume it’s a no-win situation with them.
So, let me state this clearly — I don’t believe OIM or Anaconda (or any other hard-core subduction denialist for that matter) will be swayed in any way by these posts. It’s not in their nature. This post isn’t really for them — I put all this together for: (1) genuinely interested people that may have come across contrasting ideas while surfing the web and (2) for myself because I’m a nerd and think it’s fun.
But, if Anaconda, OIM, or any other subduction denialist wishes to respond to this post I would ask that you do as I have done — provide full citations and links (if available) for any data, figures/illustrations, and papers/studies you reference. Being thorough and diligent with references may seem trivial but is necessary to avoid confusion.
–
–
References Cited (below are cited in this post, for longer list of subduction references, see here):
Barnard, 1978, The Washington continental slope: Quaternary tectonics and sedimentation: Marine Geology, v. 27.
Calvert, 2004, Seismic reflection imaging of two megathrust shear zones in the northern Cascadia subduction zone:Nature, v. 428, p. 163-166.
Normark and Reid, 2003, Extensive Deposits on the Pacific Plate from Late Pleistocene North American Glacial Lake Outbursts: The Journal of Geology, v. 111, p. 617-637.
Stanley et al., 1999, Subduction zone and crustal dynamics of western Washington: A tectonic model for earthquake hazards evaluation: USGS Open File Report 99-311; http://pubs.usgs.gov/of/1999/ofr-99-0311/
Underwood, M.B. and Moore, G.F., 1995, Trenches and trench-slope basins: in Busby & Ingersoll, eds.; Tectonics of Sedimentary Basins, Blackwell, p. 179-219.
–
Postscript: While most of the papers I cite (or are cited within the papers I cite) are not freely and easily available to the public, there is a wealth of data that is available for anyone to do science. In the past, sifting through some of these data portals was cumbersome and time-consuming. These days, many have GoogleEarth portals so you can search in the area of interest.
Two of these are the Integrated Ocean Drilling Project (IODP), and its legacy progams DSDP and ODP, and the USGS National Archive of Marine Seismic Surveys. The screenshot below shows both of these data portals for the greater Cascadia region.

Screenshot of IODP and USGS Nat'l Archive of Marine Seismic Surveys GoogleEarth data portals
When you are within GoogleEarth and click on the information, a window pops up that has links to where you can download the data and read the reports with details of acquisition. These datasets are available for you to do some science!! If you have a hypothesis that needs testing, get at it.
–
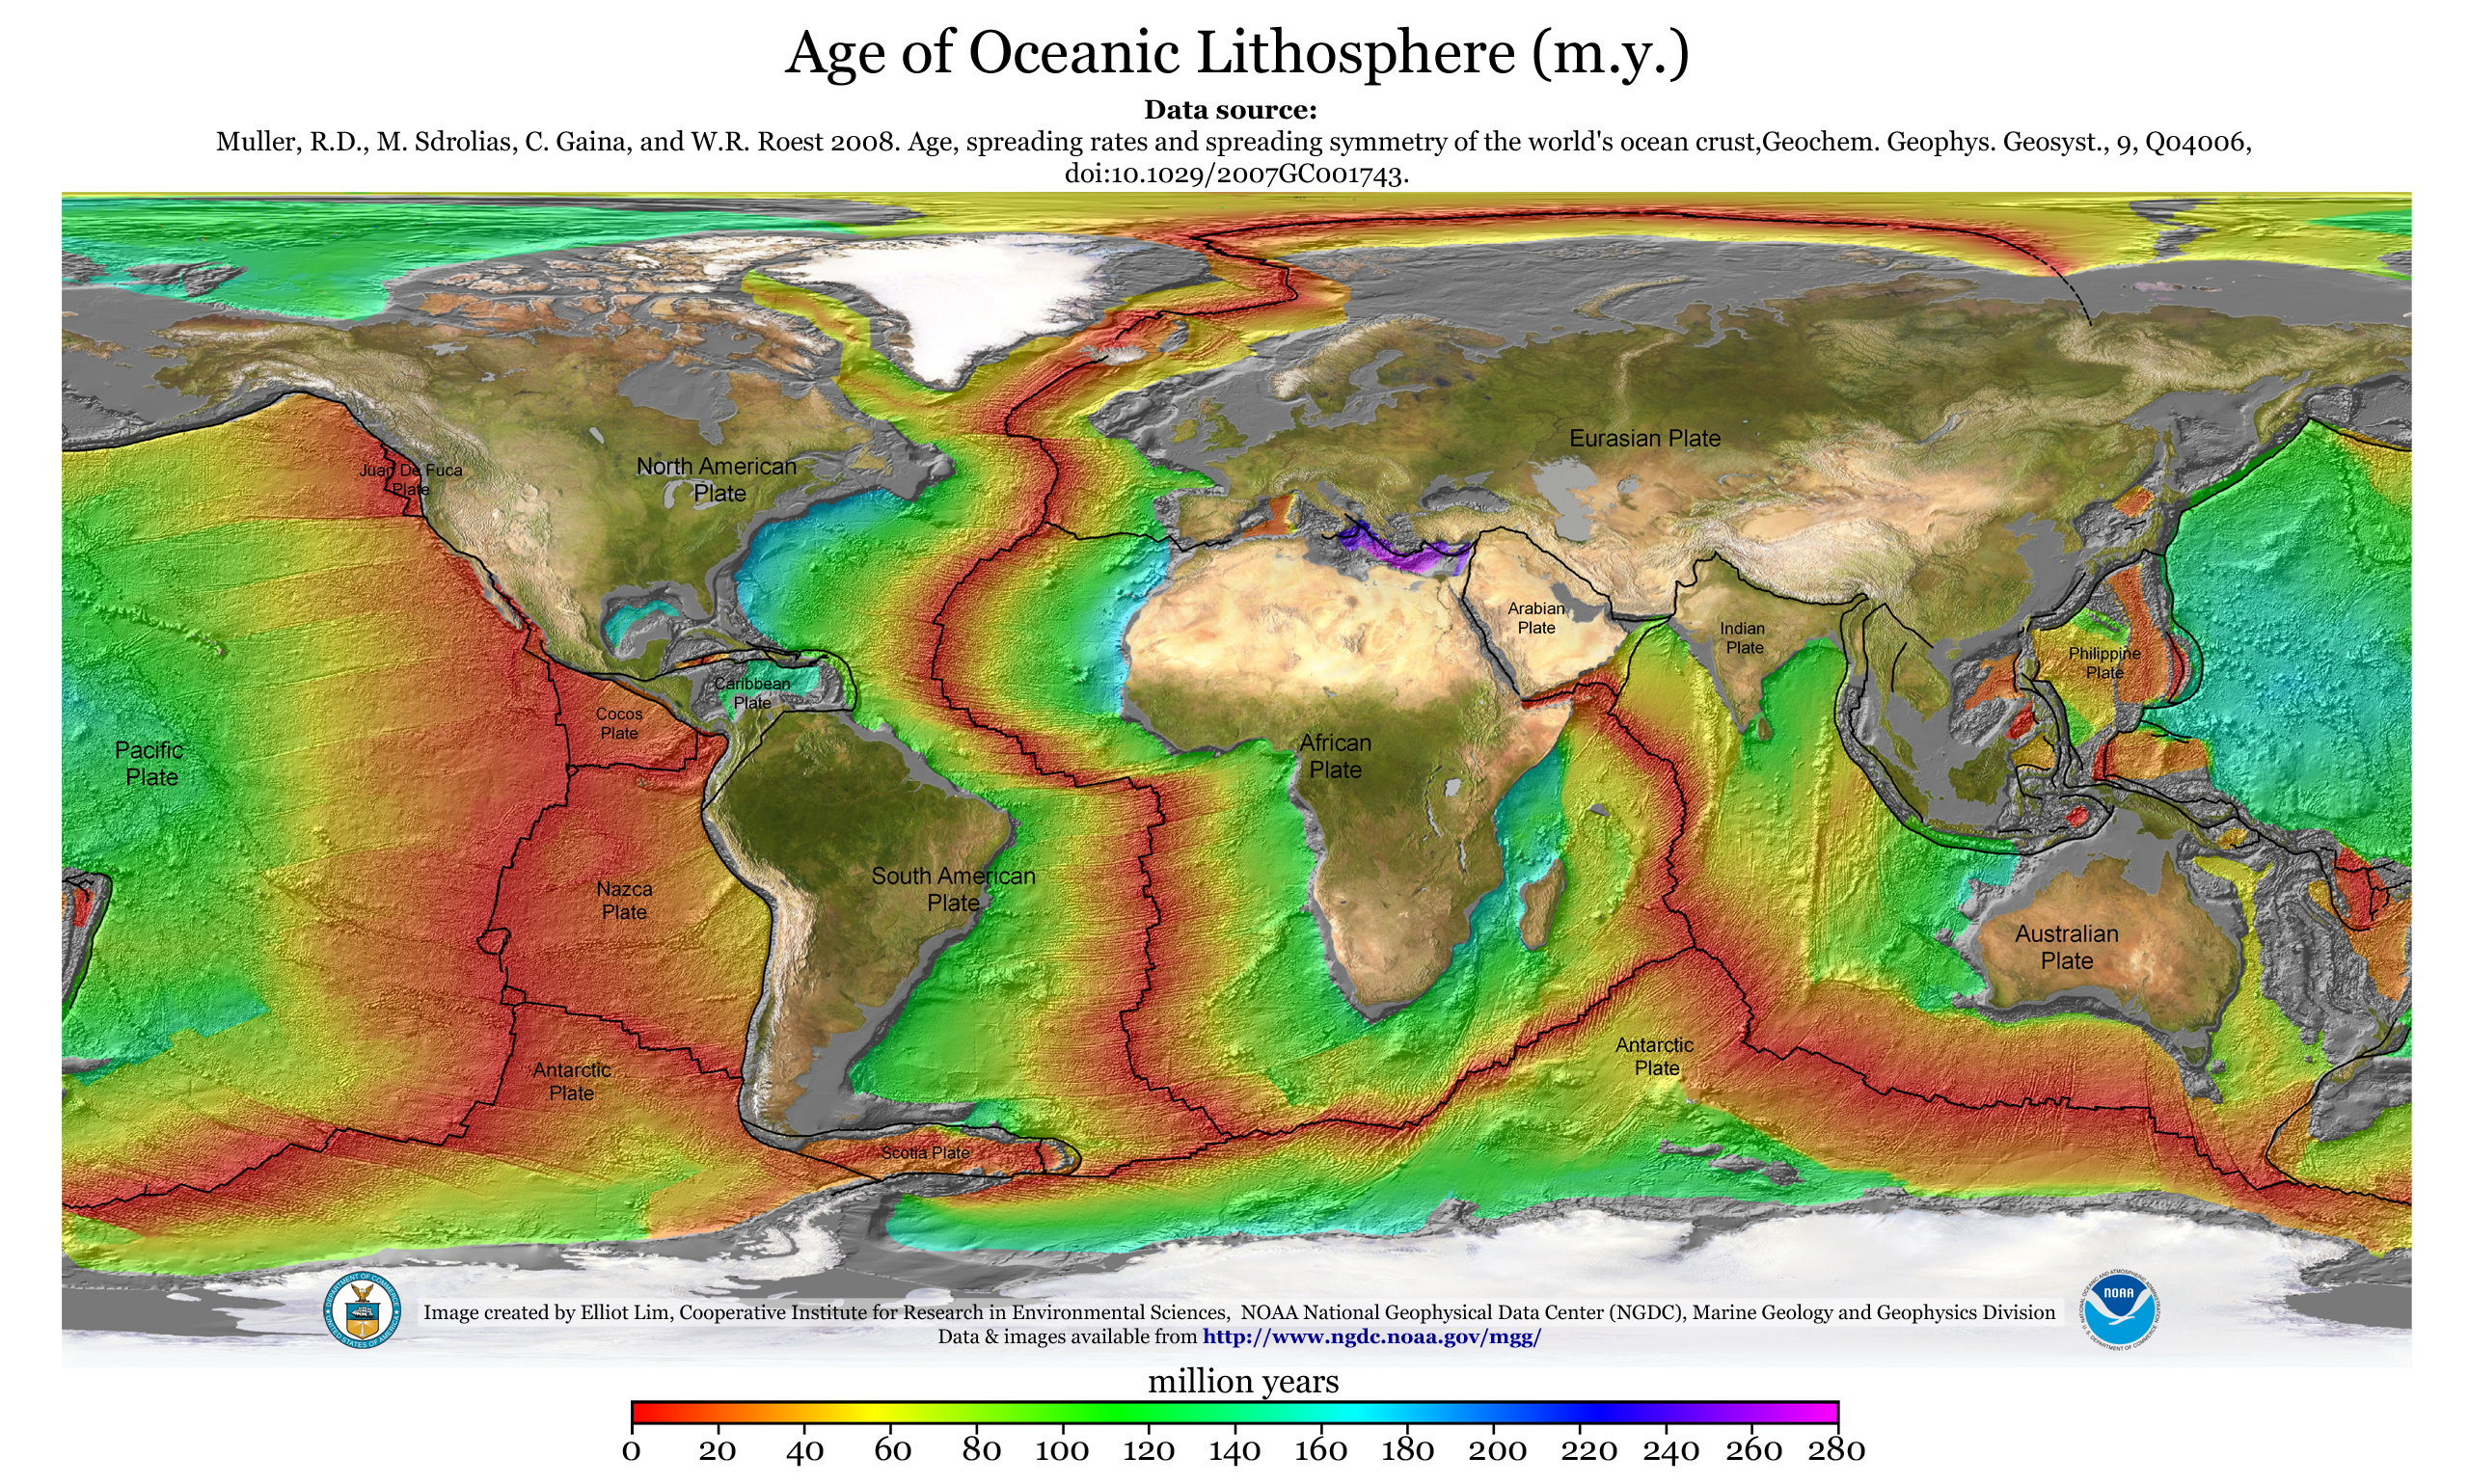
UPDATE #1 (11/17/2008): Instead of addressing any specific place or dataset presented in these posts, OilIsMastery has responded with generalities. He is suggesting that the western Pacific Plate boundary is a spreading center. He pointed to this map of oceanic crustal ages as support for this. As you can see in the comments, I’ve asked him repeatedly how the older oceanic crust (~160-120 million years old) came to be juxtaposed against the boundary — if this was a spreading center, where is the young (i.e., new) crust?
To help focus and avoid confusion … the map below zooms in on the area of interest.


–
UPDATE #2 (11/18/2008): Okay … OilIsMastery is now saying the above plate boundary is not divergent, but is called ‘orogenic’ or ‘volcanic’ … or something like that. The Nazca-South American boundary, which he originally claimed was divergent (because those are the only kind that exist, remember?), also has volcanoes and is an orogenic belt … so, I’m not quite sure how to distinguish. Hopefully he will clarify his classification scheme for everybody – bonus points if data is involved!
Subduction Denialism, Part 2: Subduction zones, trenches, and accretionary complexes
This blog has moved to Wired Science (as of Sept 14, 2010)
URL: http://www.wired.com/wiredscience/clasticdetritus/
RSS: http://www.wired.com/wiredscience/category/clastic-detritus/feed
–
Note: This is the second post in a three-part series — Part 1 from earlier today is required reading. Without it you will have no context for most of this post. After reading this, go to Part 3.
–
Alrighty … so the overall objective here is to discuss the Cascadia subduction zone and why it does not have a distinct and discernible trench like other subduction zones do. My claim to Anaconda was that (1) there has been a significant amount of sedimentation across this margin, and (2) the Cascadia margin has a robust accretionary wedge — you can see my original comment as I stated it here. These two aspects have a lot to do with the physiography of this plate boundary as we see it today.
But before I focus on Cascadia, I wanted to show some data from various modern subduction zones. I show a lot of data below without too much interpretation or synthesis. This is on purpose. For those that are skeptical of or claim subduction is a “myth”, you are welcome to interpret these data differently.
IMPORTANT: This post is not a comprehensive review of subduction, this post is not ‘one-stop shopping’ for everything you’ve ever wanted to know about subduction — what I show below is the tip of the iceberg. I list more references at the bottom of the post and at the bottom of Part 3. I strongly encourage you to familiarize yourself with the literature.
–
Maps and Profiles of Convergent Plate Boundaries
Let’s take a quick look at several of Earth’s subduction zones — to get a sense of which ones have distinct trenches and which ones do not. The following series of maps and topographic profiles were created in GeoMapApp, which is a FREE web tool for exploring Earth’s bathymetry/topography. Again … this is free … it’s not behind subscription, it’s not only for those with a university/corporate license, it’s available to the public to use for research and education. Did I mention that this tool is free?
All maps are more-or-less at the same scale.
First, the focus area for this series of posts — the Cascadia plate boundary region of the northwest United States and southwest Canada. In fact, there are three plates in this view — Pacific, Juan de Fuca, and North American.

Fig. 1a: Cascadia region bathymetry and topography (created with GeoMapApp)
Below is a topographic profile across the margin (its position marked by the white horizontal line in the map above).

Fig. 1b: Topographic profile for the Cascadia margin (created with GeoMapApp)
Next is a plate boundary that does have a significant trench — the Peru-Chile trench of the Nazca/South American margin.

Fig. 2a: Nazca-South American margin bathymetry and topography (created with GeoMapApp)
The trench is clearly visible in both the bathymetry (darkest blue color) and in the profile below.

Fig. 2b: Topographic profile across Chile trench and Andes (created with GeoMapApp)
The Sumatran subduction zone got a lot of mainstream press back in 2004 because of the devastating tsunami. As a result, there are some web resources available to the public to learn more about this area (e.g., USGS summary poster on the earthquake).

Fig. 3a: Cascadia region bathymetry and topography (created with GeoMapApp)
The Sunda Trench is not as distinct as the Peru-Chile trench but is still discernible. It becomes a much more recognizable trench in the southeast corner of the map and then off the map to the east.

Fig. 3b: Topographic profile across Sunda trench and Sumatra (created with GeoMapApp)
The Aleutian system has a pretty decent trench.

Fig. 4a: Aleutian Islands region bathymetry and topography (created with GeoMapApp)
Note that depending on where you put the profile generator (it’s fun, you should try it) the arc barely pops out above sea level.

Fig. 4b: Topographic profile across Aleutian trench and islands (created with GeoMapApp)
Here’s the Mariana system. It’s important to note that this is a full-fledged island arc system (two oceanic plates) whereas the Cascadia and Nazca-South American are continental arcs (one oceanic plate, one continental plate). The Sumatran and Aleutian systems are a bit different as their backarc regions are flooded shelfal areas (e.g., see Aleutian profile just above).

Fig. 5a: Mariana arc bathymetry and topography (created with GeoMapApp)
As you probably know, Mariana trench is the deepest/lowest place on the surface of the Earth (at nearly 11 km below sea level).

Fig. 5b: Topographic profile across Mariana trench and arc (created with GeoMapApp)
Finally, the last one in this series of maps and profiles is the Nankai Trough region offshore southeastern Japan.

Fig. 6a: Nankai Trough region bathymetry and topography (created with GeoMapApp)
The Nankai Trough is perhaps not as distinct as either the Chile trench and certainly not the Mariana, but is still noticeable in the profile below.

Fig. 6b: Topographic profile across Nankai Trough (created with GeoMapApp)
These maps and profiles were presented to show the spectrum of physiographic styles of subduction zones.
Next, I will show a few examples of data from beneath the surface. I’ll start with relatively new data acquired for the Nankai Trough region.
–
Geophysical Imaging of Subduction Zones
Observing the structure and configuration of the Earth’s crust requires geophysical imaging techniques. Reviewing geophysical theory and the various types of data acquisition and processing methods is way beyond the scope of this post. There are numerous textbooks written on the subject and I found a few good websites as well with some simple googling (e.g., here, here, here, and here).
To my knowledge, the highest-resolution subduction zone imaged to date is the last map/profile I showed above, the Nankai Trough. This is largely a result of this area being the focus area for a research project called the Nankai Trough Seismogenic Zone Experiment (or NanTroSEIZE). This program is in progress — they’ve already done a lot of seismic acquisition and some drilling into the accretionary wedge. I’ve posted about this a year ago (here) but will show the images again right now.
The first image is an absolutely gorgeous bathymetric map of the trough and accretionary complex region. The “frontal thrust” area marks the boundary between the trough and the ‘crumpled up’ (i.e., folded and faulted) accretionary wedge.

Fig. 7: Bathymetric map of Nankai Trough and Kumano Basin (from Moore et al., 2007)
This map pattern suggests a compressional structural regime. How can we test that? What does this area look like in cross section?

Fig. 8: Block diagram of 3D seismic-reflection survey of accretionary wedge offshore Japan's southeastern margin (from Moore et al., 2007)
The perspective block image above is from the 3D seismic-reflection survey. Click on it for a full resolution version. The seismic reflectors clearly show the reverse and thrust faults within the accretionary complex as well as the top of the oceanic crust underneath it. A model of converging plates explains these compressional features. A model of an Earth where there is no convergence must account for these observations (both conceptually and specifically right here on this spot on the Earth). To put it bluntly, how did the Nankai accretionary complex form without convergence?
The Moore et al. (2007) paper goes into much more detail, but if you don’t have access you can find much of these data in the IODP Expedition 314 Preliminary Report, which summarizes one of the drilling legs. In the introduction of this report, there is the following:
The Nankai Trough is a subducting plate boundary, where the Philippine Sea plate underthrusts the southwestern Japan margin at a rate of ~4.1–6.5 cm/y along an azimuth of 300°–315°N (Seno et al., 1993; Miyazaki and Heki, 2001) down an interface dipping 3°–7° (Kodaira et al., 2000).
The Nankai subduction zone forms an “end-member” sediment-dominated accretionary prism. In the toe region off Muroto, a sedimentary section ~1 km thick is accreted to or underthrust below the margin (Moore et al., 2001).
I’ve put the full citations for these references at the bottom of the post for those interested in the details about plate movement rates and azimuth measurements. As you’ll see later in Part 2, the Cascadia subduction zone shares this sediment-dominated characteristic.
The figures below are in the same general area but at a much different scale — instead of several kilometers deep into the subsurface, these seismic wave velocity profiles reveal structure 10s to 100s of km into the subsurface.

Fig. 9: Mantle wedge tomography across Honshu, Japan, after Zhao et al. (1992). Earthquake loci are projected as small open circles, relative mantle P-wave velocities are shown in colors, from red (slow) to blue (fast); (http://www.nsf-margins.org/SEIZE/Nankaifigs.html)
Although the authors of these figures, which can be found on the NSF-MARGINS site here, denote their interpretation of the subducting Pacific Plate with the black lines, one can clearly see the distinct west-dipping ‘fast’ (blue color) velocity structure. In addition, the dots show the location of earthquakes. This dipping planar zone of earthquakes that have been documented in association with plate margins interpreted as subduction zones is called the Benioff zone (or Wadati-Benioff zone).
The general relationship of earthquakes to plate boundaries is well established. The figure below (from this seismology textbook) shows global seismicity for all depths in the top figure and just the deep earthquakes in the bottom figure.

Fig. 10: Global seismicity (a) all events, (b) deep events (credit: Stein & Wysession; http://epscx.wustl.edu/seismology/book/)
These deeper earthquakes are those associated with that dipping Benioff zone as seen above in Fig. 9. These are the measurements, the observations — a model of the Earth where there is no convergence (only divergent boundaries) must account for these observations if the hypothesis is to be further tested.
–
The image below is the P-wave velocity structure of a transect of the Izu-Bonin-Mariana (or IBM) arc system. This image and much more can be found on the NSF-MARGINS ‘Subduction Factory’ initiative’s webpage for the IBM system.

Fig. 11: P-wave velocity structure of IBM arc (credit: NSF-MARGINS)
I’m not going to try and explain all the details of seismic velocity studies here — firstly, the details of it are beyond my expertise and, secondly, that’s not really the point. The P-wave velocity structure data shown above is what it is. Interpret it.
–
The next image (below) is from the Indonesia-Tonga region (north of Australia) and shows anomalous P-wave velocity structure over a 30 degree transect going down 1500 km (east to the right).

Fig. 12: P-wave velocity structure under the Indonesia-Tonga region along 30 deg segments to a depth of 1500 km (from Hall & Spakeman, 2002; Earth and Planetary Letters, 201)
The white dots in the distinct inclined blue band represent earthquake hypocenters. Again … this is just another example of data. You’ll have to read the paper for more details about their methods and how they interpret these data.
–
Okay … one more — the image below is beneath Costa Rica and again displays seismic wave velocity structure.

Fig. 13: Velocity structure underneath Costa Rica - dots represent earthquake hypocenters (from Husen et al., 2003)
Based on these (and more) data, the authors of this paper conclude:
Both the 3-D P-wave velocity structure and petrological modeling indicate existence of low-velocity hydrous oceanic crust in the subducting Cocos Plate beneath central Costa Rica. Intermediate-depth seismicity correlates well with the predicted locations of hydrous metamorphic rocks, suggesting that dehydration plays a key role in generating intermediate-depth earthquakes beneath Costa Rica.
That statement brings up composition — an additional aspect that I’m not going to address in these posts. I’m also not going to talk about arc magmatism, high-pressure/low-temperature metamorphism, and so on. Perhaps other geobloggers can chime in about those topics. But I would point out that, any conceptual model of how the Earth works must integrate ALL the information available.
At the risk of sounding like a broken record … if you disagree with the interpretations in the studies above, please study the papers in detail and evaluate the methods and conclusions. Seismology and tomography are highly technical and quantitative fields of study that take years of training and experience. If necessary, engage the authors for any clarification of acquisition, processing, or other computation related to the data presented. The vast majority of researchers respond well to sincere (and polite) inquiries about their own research. If you think their methods and data are in order, then reinterpret and present a mechanism for the observed patterns.
In addition to seismologic-based investigation of the Earth’s interior, geophysicists also use gravity and magnetics. Addressing the wealth of geophysical data from around the planet from the thousands of researchers over several decades is beyond the scope of this measly little blog post. I encourage everyone to familiarize themselves with the concepts and the data that support these concepts.
–
Accretionary Wedges
Before moving on to Part 3, which deals with the Cascadia plate margin in a bit more detail, I’ll conclude this post with some general words about accretionary wedges.
Accretionary wedges (also known as accretionary complexes or accretionary prisms) are essentially compressional fold-thrust belts composed primarily of oceanic sediment and, in many cases, continentally-derived sediment from the nearby continental plate. The faults and folds, in general, verge towards the oceanic plate (i.e., look at the black and blue lines that show the faults on Fig. 8 above). Anticlinal structures that include some landward-verging reverse faults (referred to as antithetic) are produced, with create the tectonic ridges that you can see in the bathymetric map in Figs. 7 and 8 above. Deformation and sedimentation occur concurrently and incrementally throughout the evolution of the system. There are numerous studies that examine accretionary wedges from around the world and compare and contrast their structural styles (e.g., Scholl et al., 1980 and Moore, 1989 are just two).
If you are somewhat new to the study of the relationships of tectonics and sedimentation I enthusiastically recommend the 1995 textbook ‘Tectonics of Sedimentary Basins’ edited by Busby & Ingersoll (which is apparently now out of print, but used copies can be found). The chapter on trenches and trench-slope basins (by Underwood & Moore) is a fantastic synthesis and great starting point for learning more. Regarding accretionary-style subduction zones, they state:
In accretionary subduction zones, trench-floor and oceanic-plate deposits are added to the toe of the landward trench slope (or inner slope) by imbricate thrusting. A detachment surface, or décollement, separates the upper part of the accreted section (i.e., zone of offscraping) from material that is underthrust beyond the base of the slope. Above the décollement, offscraped sediment is transferred to the accretionary prism (or accretionary wedge), and this prism displays a rugged and irregular seafloor morphology governed by numerous tectonic ridges that form by folding and fault dislocation.
Take one more look at Figures 7 and 8 above of the Nankai accretionary wedge to get a sense of these general patterns.
The figure below is a sketch that illustrates accretionary wedges quite nicely. This is a line drawing of seismic-reflection data that you can find on this site.

Fig. 14: Line drawing of seismic-reflection data showing features of the Nankai accretionary wedge (http://www.netl.doe.gov/technologies/oil-gas/FutureSupply/MethaneHydrates/about-hydrates/nankai-trough.htm)
It’s important to note that although accretionary wedges from around the planet share certain general characteristics, each one has unique and idiosyncratic features as well.
Part 3 investigates the Cascadia plate boundary region with special emphasis on the sedimentation history and accretionary wedge.
–
References Cited (note: this is the list for the specific papers referred to above, see this longer list for more about subduction in general):
Busby and Ingersoll, 1995, Tectonics of Sedimentary Basins, Blackwell.
Kinoshita, M., et al., 2008, IODP Expedition 314 Preliminary Report, NanTroSEIZE Stage 1A; doi:10.2204/iodp.pr.314.2008
Kodaira, S., Takahashi, N., Park, J., Mochizuki, K., Shinohara, M., and Kimura, S., 2000. West-ern Nankai Trough seismogenic zone: results from a wide-angle ocean bottom seismic survey. J. Geophys. Res., 105:5887–5905.
Miyazaki, S., and Heki, K., 2001. Crustal velocity field of southwest Japan: subduction and arc-arc collision. J. Geophys. Res., 106(B3):4305–4326. doi:10.1029/2000JB900312
Moore et al., 2007, Three-dimensional splay fault geometry and implications for tsunami generation: Science, v. 318, p. 1128-1131. DOI: 10.1126/science.1147195
Moore, G.F., et al., 2001. New insights into deformation and fluid flow processes in the Nankai Trough accretionary prism: results of Ocean Drilling Program Leg 190. Geochem., Geophys., Geosyst., 2(10). doi:10.1029/2001GC000166
Moore, G.F., Taira, A., Klaus, A., et al., 2001. Proc. ODP, Init. Repts., 190: College Station, TX (Ocean Drilling Program). doi:10.2973/odp.proc.ir.190.2001
Moore, J.C., 1989, Tectonics and hydrogeology of accretionary prisms: role of the decollement zone: Journal of Structural Geology, v. 11, p. 95-106.
NSF-MARGINS SubFac (subduction factory) research initiative website: http://www.nsf-margins.org/SF/SF.html
Scholl, D.W., vonHuene, R., Vallier, T.L., Howell, D.G., 1980, Sedimentary masses and concepts about tectonic processes at underthrust ocean margins: Geology, v. 8, p. 564-568.
Seno, T., Stein, S., and Gripp, A.E., 1993. A model for the motion of the Philippine Sea plate consistent with NUVEL-1 and geological data. J. Geophys. Res., 98:17941–17948.
Underwood, M.B. and Moore, G.F., 1995, Trenches and trench-slope basins: in Busby & Ingersoll, eds.; Tectonics of Sedimentary Basins, Blackwell, p. 179-219.
–
Other References on Note:
List of projects and publications from Stanford University’s Crustal Geophysics Research Group.
List of research projects from Harvard Seismology group.
Plate Tectonics I and II modules from VisionLearning website.
Fowler, 2004, The Solid Earth: An Introduction to Global Geophysics: Cambridge University Press, 704 p.
Lowrie, 1997, Fundamentals of Geophysics: Cambridge University Press, 368 p.
Shearer, 1999, Introduction to Seismology: Cambridge University Press, 204 p.
Stein and Wysession, 2003, An Introduction to Seismology, Earthquakes, and Earth Structure: Blackwell Publishing.
Turcotte, 2001, Geodynamics: Cambridge University Press, 528 p.
A great popular/nontechnical book is Naomi Oreskes ‘Plate Tectonics: An Insider’s History of the Modern Theory of the Earth’.
Subduction Denialism, Part 1: The Backstory
My regular readers are going to need some context and backstory to what motivated writing this series of posts. It’s a three-part series — here is Part 2 and Part 3.
I recently had an exchange with some Earth hypothesizers* on a blog that claims convergent plate boundaries are a “myth” and in fact the Earth has expanded significantly (about double the size it was ~200 m.y. ago). The post in question can be found here and has all the information you need to learn about the expanding Earth hypothesis.
Here’s the gist: since subduction doesn’t occur but crustal generation at spreading centers does, the result is net growth of the Earth. There is all sorts of theoretical evidence for expansion as argued by subduction denialists — geometric constraints, that the universe is also expanding, lack of Earth-like plate tectonics on other planetary bodies, claims that subduction violates fundamental laws of physics, and — every denialists favorite — emphasizing and amplifying any and every uncertainty or anomaly in plate tectonic theory^.
I’m really not that interested in discussing speculative theoretical constraints. I’m also not interested in arguing about whether or not the size of the Earth has remained exactly constant (to some unmentioned level of precision). There might be some interesting discussions to be had in this regard and perhaps a topic for the future, but for these posts I will focus on the claim that plate convergence does not occur. This is a specific claim that we can address by investigating observable patterns. Theoretical discussions and “thought experiments” can indeed be entertaining and, in some cases, intellectually rewarding — but for this specific claim I’d rather stick to data and observations.
The specific context for my posts is in the comment thread on that blog. It’s quite long and has several off-topic tangent discussions, so I will provide you the highlights:
–
(1) After reading the contents of the post, I inquired about the Nazca plate specifically (to help focus discussion) and the blog owner, called ‘Oil Is Mastery’ (whom I will hereafter refer to as OIM and make his comments this color), replied by saying:
The Nazca plate cannot possibly be subducting as zircon data shows conclusively that it is spreading in all directions
OIM is referring to this map from NOAA’s NGDC website showing ages of oceanic crust. I replied (my comments shown in this color):
The Nazca plate is older (the yellowish color on the NGDC map) right near the ‘armpit’ of the South American continent. If it was “spreading in all directions” … then where is the eastern divergent boundary?
OIM then replied by saying:
The eastern so-called “divergent boundary” of the Nazca Plate is the Andes Mountain Range.
Interesting. The Andes Mountain Range is a spreading center? Hmm. I was confused so I asked for clarification. At first I got some other stats, so I asked again, and then OIM proclaimed his position clearly and succinctly:
Of course it [Nazca and South American plate boundary] is a divergent boundary since those are the only kind that exist. Convergence and subduction are myths.
Emphasis mine. I then asked:
Can you draw a sketch cross section showing that spreading center in relation to the Chile-Peru trench and the Andes? I’m interested in how fold-thrust belts form w/out compression. Thanks.
OIM was never to be heard from again on that thread — I assume that means he either can’t or is unwilling to expand on his Andes divergent boundary hypothesis. He did, however, go on to post about his calculations proving increase in Earth’s diameter since the ancient Greeks, showing biogeographical evidence that subduction does not occur, and a rather bizarre conflation of fascism and plate tectonics (?).
–
(2) It is at this point that I then engaged with a loyal follower and prolific commenter on OIM’s blog … a commenter named ‘Anaconda’. Anaconda’s comments on OIM are typically quite lengthy and comprehensive. I’ve sparred with Anaconda in the past on a different topic, but that’s a story for another day.
To his credit, Anaconda initiated the discussion with a short review of some of the information on Wikipedia’s page on subduction, which you can read for yourself. Wikipedia may be useful for trivia, but is more often than not unsatisfying when it comes to scientific topics. But, it does typically come up first in searches and can sometimes be a good place to start. After that brief review Anaconda started his assault on plate convergence by saying (I’ll put Anaconda’s comments in this color):
An interesting note is that the Wikipedia entry for subduction offers little scientific evidence in its favor.
Oh, there is a long description, but these descriptions are based on the presumption that subduction does exist.
It seems to be held “self evident” that subduction occurs.
So, it’s interesting that the best scientific evidence for subduction is not listed under subduction, itself, but as a counter-argument to Expanding Earth theory.
In reponse to this, I replied:
In many scientific ideas, it’s difficult to point to a single, or even a handful, of papers that provide all the evidence. The evidence comes from the totality of decades of work. The very fact that there is so much work done makes it challenging to show the work.
In that spirit I’ve listed below enough references about subduction to give you a taste (i.e., this is not a “complete” list). These include geophysical (especially seismic tomography and seismologic), geochemical, petrological, mapping/observational, and experimental studies. Not all, but many, of the Earth’s subduction zones are covered in this list. At the end I’ve also included a list of textbooks … these are the best place to start. As bonus, I’ve included some relevant websites.
I’m not here to defend each and every one of these studies … Take some time and familiarize yourself with the literature and the concepts. There’s a wealth of data presented in these papers that need reinterpreation and re-evaluation if you disagree with their conclusions.
I won’t reproduce the list here, but you can see it in my comment on that thread (in case it gets deleted, I’ve reproduced the list here). It includes nearly 70 peer-reviewed papers, five textbooks, and several websites. At first, Anaconda appreciated this list … later he dismissed it as a “laundry list” and was upset that he didn’t have access, which I’ll discuss more below.
–
(3) The thread went off-topic for a few comments, but then came back to subduction. Earlier in the thread I asked OIM how fold-thrust belts (i.e., large-scale compressional tectonics) develop in the absence of convergence. I never received and answer from OIM, but Anaconda stated:
An issue has been brought forth that one must explain the presence of thrust-fold belts without subduction for Expanding Earth theory to have any merit at all.
And among the list [Wikipedia’s list of fold-thrust belts] are many areas that are not and never have been associated with subduction.
So the idea that without subduction zones you can’t have thrust-fold belts is inaccurate.
I asked Anaconda which fold-thrust belts from that list were not or were never associated with subduction zones, to which he responded with a list of major orogenic belts from the North American Cordillera. I honestly don’t know as much about the geology of mountains in Mexico or Canada — just my own location bias. If others do, please comment below. But, the “Wyoming-Utah Thrustbelt”, called the Sevier in the literature, is Cretaceous in age and associated with the convergent western margin of the continent at the time (which also produced the now-partially-exhumed magmatic arc of the Sierra Nevada).
The Rocky Mountains are on this list, although I’ve never thought of them as a typical fold-thrust belt, but I suppose they can be considered as such within this very general context. The Rockies are a bit younger, involve thick- vs. thin-skinned deformation, high-angle reverse faults, basement uplifts, reactivation and/or inversion of older tectonic features, and are interpreted to be a result of a shallowing of the subducting slab. The details of this interpretation are still hotly debated and more work is always being done.
But, this post isn’t about explaining every detail of these fold-thrust belts. There are entire books and entire series of books written on the subject (GSA’s DNAG series from the 1980s comes to mind). The fundamental question in my mind is how compressional deformation of rocks over large regions (i.e., reverse faulting, thrust faulting, folding) can even occur without convergence? If there is only divergence and extension, how is something like this, for example, produced? What is the mechanism?
When Anaconda wondered what geologists thought the mechanism for orogenesis (i.e., mountain building) was pre-plate tectonics and I told him it was geosynclinal theory, to which he replied:
Briefly, [geosynclinal theory] held that vertical crustal movement was primarily responsible for orogeny development.
Do I hear echoes of an expanding Earth?
Huh? And then:
Yet, each and every Geosynclinal theory paper was cast aside, never the less. Apparently today’s geologists don’t feel the need evaluate each and every paper because they are derivative of a theory today’s geologists think is wrong.
Wrong. The papers weren’t cast aside, the idea was. The sign of a good paper is a clear separation of data, observations, and measurements from the interpretation and implications. When plate tectonics concepts were being postulated and discussed in the literature and at conferences in the 1950s and 1960s researchers went back to these old papers and re-evaluated them. They revisited the old datasets and saw them in a different light. In many cases, new papers were written. As for the suggestion that modern geologists don’t evaluate old papers, Anaconda couldn’t be more wrong. Look at the list of references for papers that deal with surface geology and I bet that the majority of them have a reference to a pre-plate tectonic paper or, in many cases, a published geologic map. For my master’s degree, I leaned heavily on P.B. King’s classic 1940s work on west Texas geology. A lot of his ideas about how the patterns came about have been revised over the years, but the documentation of the patterns themselves are robust and everlasting. In other words, I was able to use his data and observations to support a different interpretation.
So, do I think Anaconda (or any other subduction denialist) needs to debunk each and every single paper in the literature that documents compressional features? No, of course not. But, they should be able to explain the data and observations presented in these papers within the context of their mechanism for their formation.
–
(4) Okay … now on to what dominated the remainder of the thread and what is the focus of Part 3 in this series — the Cascadia subduction zone (Pacific Northwest of the United States).
In addition to fold-thrust belts that Anaconda thought were unassociated with convergence, he also wondered about trenches:
The Cascadia Subduction Zone doesn’t have a trench, other alleged subduction zones have a trench.
The suggestion being that since not all subduction zones have a distinct physiographic trench expressed on the sea floor (i.e., linear trough-like bathymetric depression between the subducting plate and the overriding plate) then there must be something erroneous about the whole concept. For the time being, let’s put aside the question of how trenches develop in some places and not in others on an Earth with no convergence … we’ll let the subduction denialists explain that (as they should). But, this is a great question — I responded:
Cascadia trench is over-filled with sediment, does not have sea-floor expression … also has significant accretionary complex.
That is my unedited comment … in retrospect, it’s incomplete and oversimplified. I thought it required more explanation so I offered to do some research on the particular topic of the Cascadia subduction zone, especially with respect to sedimentation, and put together a post (which you are reading right now). Anaconda agreed that would be a good idea:
Yes, the Cascadia Subduction Zone is a good place to start.
But a bit later he got peeved at me when I suggested he conduct some of his own research in the meantime. With regards to not having internet access to some journals, he stated:
Laundry lists of papers that aren’t available on the internet are not helpful. One must also be careful that laundry lists are not a substitute for actually presenting a case.
…and
Lists without ready access for the reader tend to be a substitute for substantive scientific argument.
…and, finally
Your Eminence,
We, unwashed groundlings patiently await your return from the great ivory tower. Master of the academy have forbearance, not all the little people of the internet have access to the great libraries hosted in the hollowed halls of academia.
We humbly await your discerning directions to the great trench of Cascadia.
Your most obedient internet groundling,
Anaconda of the little people
Clever. A bit of a persecution complex I think … as if “we” are keeping the truth from “them” … very conspiratorial. Open access is a much talked about issue and continues to be debated in academia. That is beyond the scope of this post but, in this case, it would be valuable if more peer-reviewed articles were freely and openly available to the public.
Finally, I told Anaconda multiple times that it would take some time to do this — real research takes a lot of work and I’ve got other things going on, so I end up working on this stuff bit by bit in the evenings:
This may not be posted for another week or two due to other things going on in my life…
Less than 90 minutes later, Anaconda replied:
I’m still patiently waiting for a paper demonstrating a “trench overfilled w/ sediment”
First of all — I said a week or two, not an hour or two. Secondly, even though earlier in the thread I described how it’s often difficult to point to a single paper for specific questions, Anaconda now twists the words as if I claimed I was going to give him a single paper. Typically, researchers need to spend the time searching and reading what’s already been done and do some synthesis on their own. We all know this.
Well, sorry Anaconda … I never claimed there would be a single paper neatly addressing the topic on hand. Compiling and synthesizing existing research requires referring to numerous studies. I will, however, try my best to high-grade the list to the most relevant and not just inundate you with a long list.
–
Part 2 of this series briefly reviews the physiographic expression of subduction zones, in general, and Part 3 goes into some detail regarding the Cascadia subduction zone specifically.
–
* I‘m not sure what else to call them, they aren’t scientists (by their own admission) – I don’t know, perhaps “enthusiasts”?
^ I’m not saying that anomalous observations that challenge our understanding shouldn’t be investigated … in fact, quite the opposite. That’s what makes an interesting research project and that’s how science progresses. But the subduction denialists aren’t doing any actual analysis — they don’t take it the next step and propose mechanisms SPECIFIC TO THAT DATA — they generalize and claim that the anomaly once and for all disproves plate tectonics and, by default, supports their hypothesis.
–
Wild animals in the field
I started the domesticated animals in the field meme a few days ago — it has now evolved into a wild animals in the field meme.
If you’ve been reading this blog for a while, you probably have seen these already.
Hawk in Patagonia

Hawk in Patagonia (© 2008 clasticdetritus.com)
–
Guanaco in Patagonia

Guanaco in Patagonia (© 2008 clasticdetritus.com)
–
Andean Condor in Patagonia (he’s helping us do some clast counts on that conglomerate)

Andean Condor in Patagonia (© 2008 clasticdetritus.com)
–
Zebra in a reserve in South Africa (see more photos from here on this post)

Zebra in South African reserve (© 2008 clasticdetritus.com)
–
A couple Ibis on a fence in Patagonia

Ibis in Patagonia (© 2008 clasticdetritus.com)
–
A pygmy owl in Patagonia (this adult is about the size of your fist)

Pygmy Owl in Patagonia (© 2008 clasticdetritus.com)
–
Also check out this post with a video of some Austral Parakeets near our campsite in Patagonia.
~~~~~~~~~~~~~~~~~~~~~~~~~~~~~~~~~~~~~~~~~~~~~~~~~~
Sea-Floor Sunday #34: Hawaii bathymetry
A real quick Sea-Floor Sunday this week … this is a beautiful perspective image of the Big Island of Hawaii with the other islands in the distance. The gray colors represent what is above sea level, the pinks shallower water and then dark blue for the deep.

Perspective bathymetric image of the Big Island of Hawaii (© Hawaii Mapping Research Group)
There are some other maps and the actual data available at the Hawaii Mapping Research Group site. You can see all the maps here.
~~~~~~~~~~~~~~~~~~~~~~~~~~~~~~~~~~~~~~~~~~~~~~~~~~
Friday Field Foto #71: Sheep like geology too
While on a trip to look at some famous turbidites in the French Alps a few years back (the Eocene-Oligocene Annot Formation — where Bouma did his thesis) we were slowed down by a sheep drive (is that the right term?) going up the mountain road.

Sheep on the road, southeastern France (© 2008 clasticdetritus.com)
Although it may appear that these sheep are hugging the side of the road to get out of the way of traffic … really they are interested in the siltstone and fine-grained sandstone outcrops.
Who else has field photos that include domesticated animals?
–
Check out this post for more about these rocks.
~~~~~~~~~~~~~~~~~~~~~~~~~~~~~~~~~~~~~~~~~~~~~~~~~~
