Spectacular 3D seismic-reflection images of a subduction zone
Three-dimensional seismic-reflection imaging is not new. The petroleum industry has been utilizing this tool to characterize the complex geometries of the subsurface for nearly two decades. Science has benefited from these data tremendously.
However, the bulk of the 3D seismic data are from sedimentary basins (that’s where the hydrocarbons are). A paper in last week’s issue of Science showcases some new data collected from the Nankai Trough, which is a subduction zone. A couple of months ago I blogged about future drilling projects in this same region.
The figures below are directly from the Moore et al. paper.
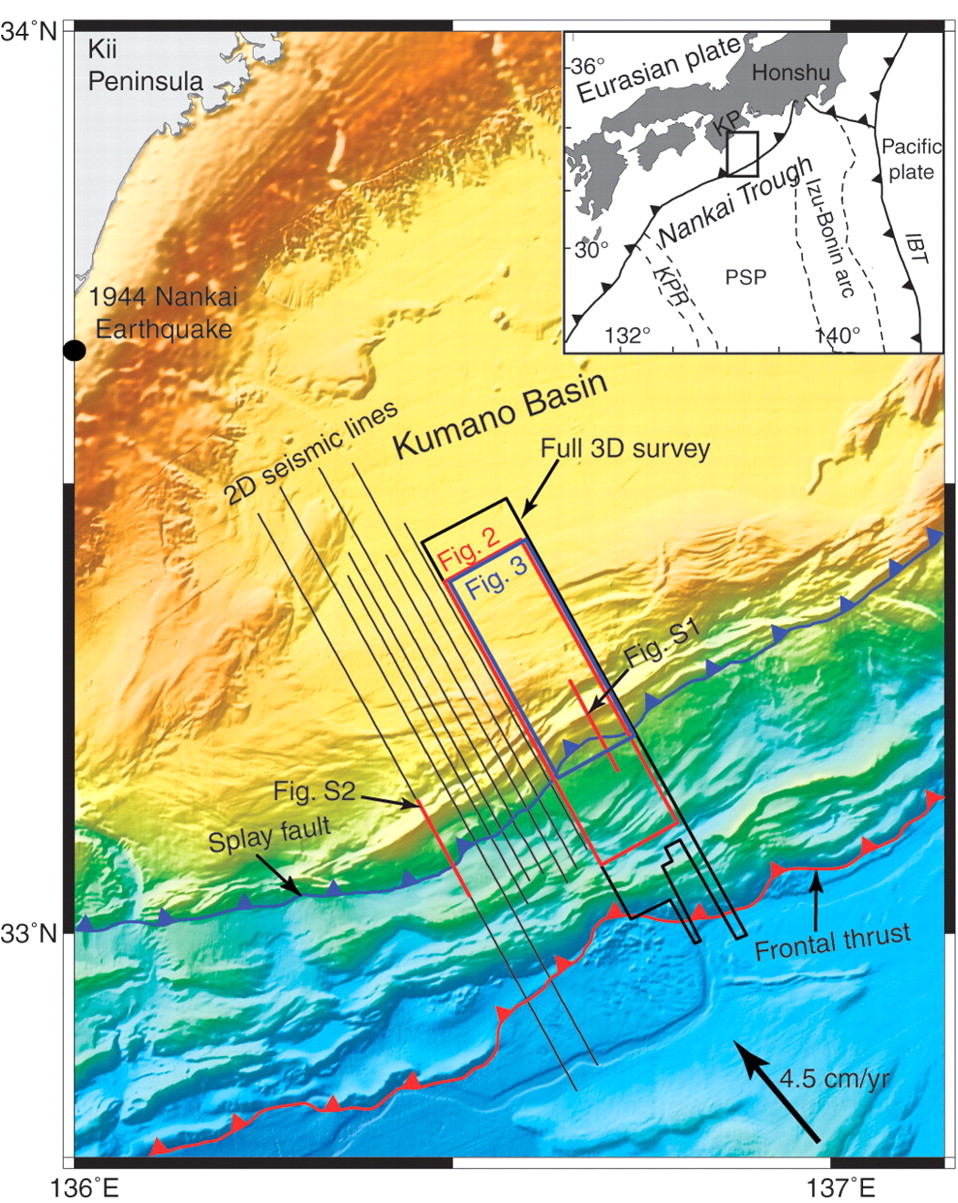
This first one is a map showing the bathymetry and location of the seismic surveys. The folding associated with the convergence shows up quite nice as those “wrinkles” on the sea floor.
This next one is a perspective block diagram beautifully showing both cross-sectional and map views of the accretionary wedge. This is a nice big, high-res image so it is worth clicking on.

The paper is worth checking out for more images and a nice discussion on the large-scale thrust fault geometries related to this convergent plate margin.
If you don’t have access to Science, here’s a blurb about the study from ScienceDaily.
~~~~~~~~~~~~~~~~~~~~~~~~~~~~~~~~~~~~~~~~~~~~~~~~~~~~~~~~~~~~~

Trackbacks