Sea-Floor Sunday #19: Scotia Sea
This week’s Sea-Floor Sunday image is another regional view and another image highlighting plate tectonic features. I created using GeoMapApp (it’s super easy, try it!).
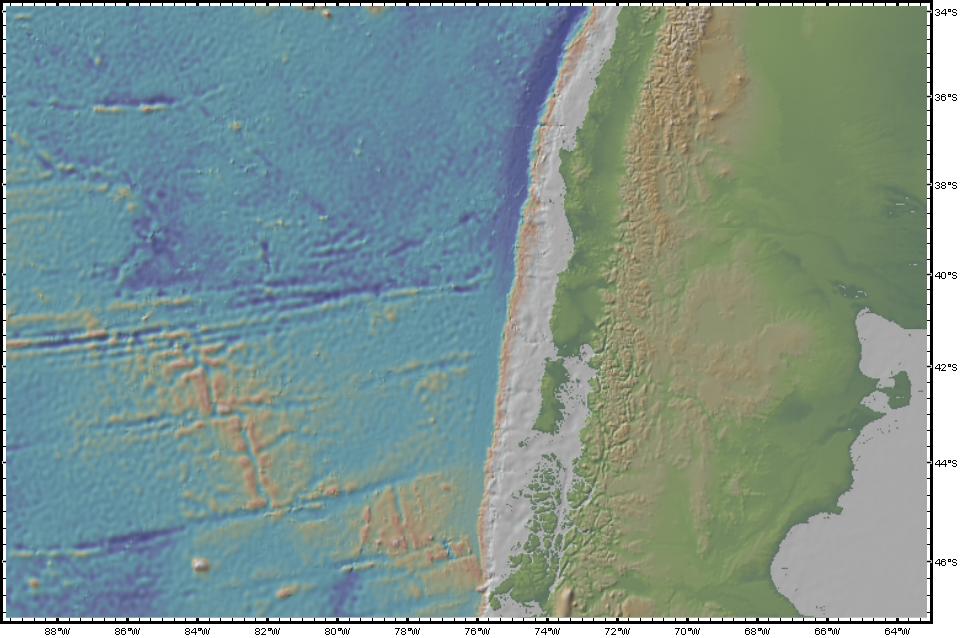
This image is of the Scotia Sea, which separates the southern tip of South America from the northern tip of the Antarctic Peninsula. Note that I rotated the image such that north is to the left.
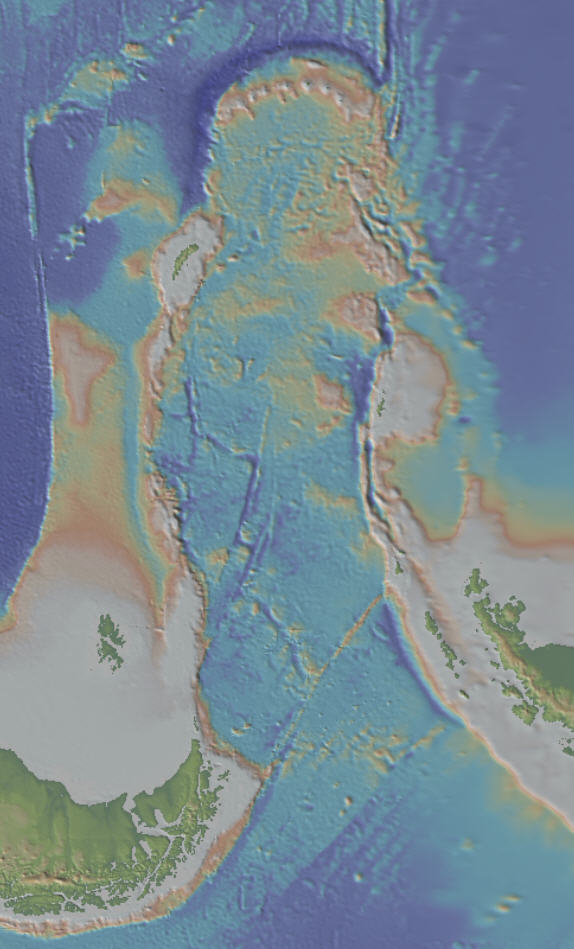
As you might tell by looking at the bathymetry, this is a pretty complicated area tectonically. There’s subduction occurring at the top of the image and east-west oriented strike-slip movement along the prominent submarine ridges (some of which pop out as islands). The Sandwich Plate is separated from the Scotia Plate by an area of sea-floor spreading that is not immediately apparent on the bathymetry.
The map below shows the seismicity of the same area (from this USGS site) and is useful to compare with the bathymetry. Note the tiny Sandwich Plate behind the seismically active subduction zone at the top of the image.
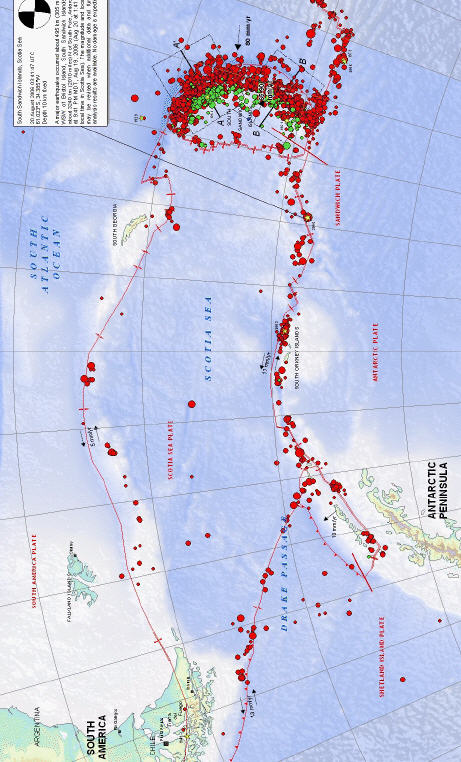
The relative strike-slip movement of the South American and Antarctic plates has created the two major transform fault zones that define the Scotia Plate. Note the eastward “bending” of the tips of South America and Antarctic Peninsula.
In a very superficial way, this geometry is similar to the Caribbean Plate caught between the North and South American plates — a strike-slip-bounded “tongue” with a subduction zone at the tip of the tongue.
~~~~~~~~~~~~~~~~~~~~~~~~~~~~~~~~~~~~~~~~~~~~~~~~~~~~~~~~~~~~~~~~~~~~~~~~~~~~~~
Video of group of street drummers
This is awesome.
It’s about 4 minutes … and really gets going about a minute in.
They are tight! Amazing.
~~~~~~~~~~~~~~~~~~~~~~~~~~~~~~~~~~~~~~~~~~~~~~~~~~~~~~~~~~~~~~~~~~~~~~~~~~~~~~
Friday Field Foto #51: Patagonian wind
Actually … I guess today should be Friday Field Video …
After seeing another blogger’s video highlighting the wind of Patagonia, I decided to upload and post a very short video I took this past February while doing field work in southern Chile (~51°S). The quality is not that great (from the video function on my digital camera), but you can get sense of the wind. This is pretty standard … it’s often much worse.
The photo below is the best still shot I have that effectively communicates the wind in a snapshot. This was taken by another student who was helping us collect data in 2004. That’s me on the right.
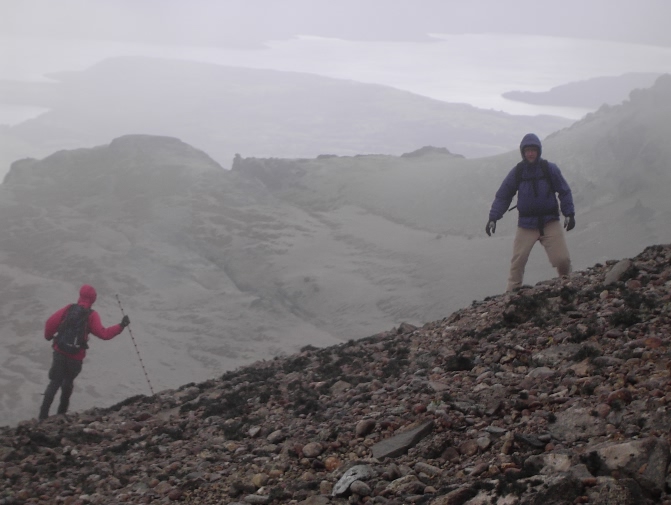
Happy Friday!
~~~~~~~~~~~~~~~~~~~~~~~~~~~~~~~~~~~~~~~~~~~~~~~~~~~~~~~~~~~~~~~~~~~~~~~~~~~~~~~~~~
A press release title that irks me
I’m sure this will make the rounds in the geoblogosphere … at least I hope so. I don’t have the time right now to find and read the paper … please comment and/or link to it below.
A press release with this title just came across my feed reader:
Hot Climate Could Shut Down Plate Tectonics
Oh no!! Not another negative impact of global warming! Oh wait … no, it’s just another sensationalized press release title that could mislead the public.
Here’s the key statement from one of the authors of the paper:
We found the Earth’s plate tectonics could become unstable if the surface temperature rose by 100 degrees Fahrenheit or more for a few million years,” Lenardic said. “The time period and the rise in temperatures, while drastic for humans, are not unreasonable on a geologic scale, particularly compared to what scientists previously thought would be required to affect a planet’s geodynamics.
Hmm … a rise in surface temperature of 100 deg Farenheit over a few million years … let’s say it again … 100 deg Farenheit over a few million years
Another statement within the press release reveals what the study is actually about:
Lenardic said the research team wanted to better understand the differences between the Earth and Venus and establish the potential range of conditions that could exist on Earth-like planets beyond the solar system.
This sounds really cool!! I’m interested in learning more for sure.
My beef is that the title of the press release (which I would bet wasn’t written by the scientists) is extremely misleading. It’s difficult to imagine that whoever did write this title did not anticipate some confusion with respect to the hot (pun intended) topic of the day — global warming. The scales of both temperature change and time are not even close. Several degrees vs. 100 and several centuries vs. a few million years. Furthermore, the title explicitly refers to a prediction. With prediction and forecasting of climate at the decadel and centennial scale getting increasingly more attention in the press, might it have been prudent to qualify this statment with the “few million years” caveat?
To me, this is another example of sensationalized sound-bite science that has the potential to mislead the public. I’m all for getting the public excited about science news … but, at what cost for perpetuating or instigating significant misunderstandings?
~~~~~~~~~~~~~~~~~~~~~~~~~~~~~~~~~~~~~~~~~~~~~~~~~~~~~~~~~~~~~~~~~~~~~~~~~~~
Pangea Day – where was your bedrock?
Following the lead of Chris at goodSchist and Callan at NOVA Geoblog, below is a snapshot of global paleogeography during the Late Triassic – just before the supercontinent of Pangea broke up – and where I sit right now on that map (small red circle). All images on this post are from Ron Blakey’s (Northern Arizona Univ.) fantastic website of paleogeographic maps and globes.

I’m in the San Francisco Bay Area of California and, as you can imagine, it is quite difficult to pinpoint the area. Much of northern California was in the process of getting accreted onto the continent. Central and southern California is even tougher to place precisely because of more recent San Andreas right-lateral movement.
In addition to the global maps, Blakey has created some zoomed int a bit to North America. This is Late Triassic again (~210 million years ago). The subduction zone that developed on the western margin of the continent during the Mesozoic is getting going around this time. Where I actually sit right now was probably offshore somewhere.

Check out these maps and give it a shot!
–
In case you’re wondering what prompted this meme – this past weekend was a global event called Pangea Day, meant to bring people across the world together through film.
~~~~~~~~~~~~~~~~~~~~~~~~~~~~~~~~~~~~~~~~~~~~~~~~~~~~~~~~~~~~~~~~~~~~~~~~~~~~~~~~~
As everyone knows now, an Andean volcano in Chile, Chaitén, erupted this past week. We’ve all seen those spectacular images and The Volcanism Blog continues to deliver great update posts.
So, for this week’s Sea-Floor Sunday, I quickly created this simple image using GeoMapApp. I thought a regional map of topography and bathymetry might be a nice complement to all the other images for Chaitén.
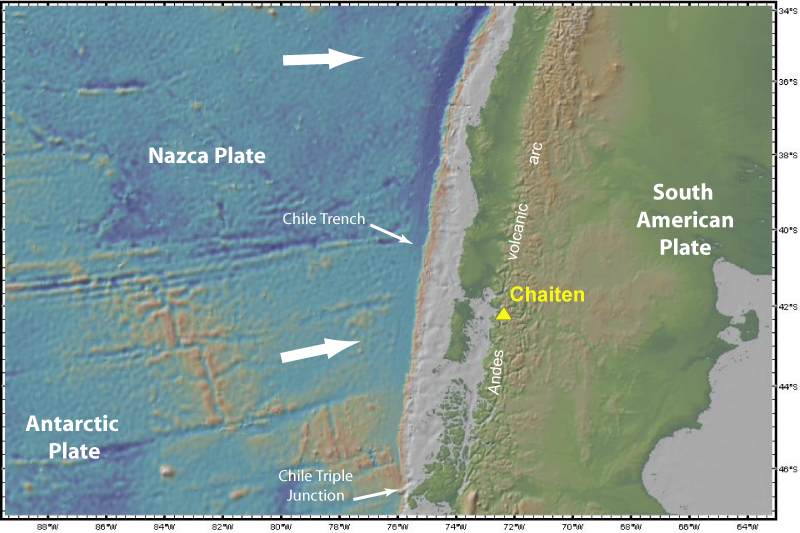
To see global map of plate boundaries, check out this map.
–
Geology.com has a great page with maps, images, and video for the Chaitén eruption here.
The Volcanism Blog has a post summarizing Chaitén web resources as well.
~~~~~~~~~~~~~~~~~~~~~~~~~~~~~~~~~~~~~~~~~~~~~~~~~~~~~~~~~~~~~~~~~~~~~~~~~~~~~~~~~~~~
NOTE: This post was included in Classic Science Papers 2008 Challenge, which has posts about a classic paper across many disciplines. That list was expanded and became the first installment of a new science blogging carnival called “The Giant’s Shoulders”. See more about the carnival here and see the expanded first installment on A Blog Around The Clock here.
—–
 I finally found made some time to finish the second installment of the Theoretical Stratigraphy series. The first installment looked at a paper from 1964 and dealt with the concept of baselevel as it applies to sedimentation and the long-term preservation of sedimentation (or, stratigraphy). For this post, I will take you back to an even earlier paper:
Barrell, J., 1917, Rhythms and the Measurements of Geologic Time: Bulletin of the Geological Society of America, v. 28, p. 745-904.*
Before I get into the ideas of the paper, the first thing to note is the style of writing. Simply look at the page range in the citation above … these old-school scientists were verbose! If you’re looking for concise statements and something you can digest quickly, this is not the place to go. But, if you’re in the mood to read some great scientific prose and dive deep into an idea, these old papers can be a delight. Here’s the opening sentence:
Nature vibrates with rhythms, climatic and diastrophic, those finding stratigraphic expression ranging in period from rapid oscillation of surface waters, recorded in ripple-mark, to those long-deferred strirrings of the deep imprisoned titans which have divided earth history into periods and eras.
How great is that?
Just as a note, the term ‘diastrophic’ is a no-longer-used term referring to the deformation of the Earth’s crust … so, in essence, Barrell is citing climate and tectonics as the two major forcings on sedimentation and stratigraphic patterns. I’ll come back to this later.
–
STRATIGRAPHY?
If you’re new to this blog or stratigraphy in general, it’s worth taking a moment to discuss it. What is stratigraphy? I googled it just to see what comes up first:
- Merriam-Webster online => “Geology that deals with the origin, composition, distribution, and succession of strata; the arrangement of strata.”
- Answers.com => “The study of rock strata, especially the distribution, deposition, and age of sedimentary rocks.”
- Wikipedia => “The branch of geology that studies rock layers and layering (stratification)”.
Those are fine, I suppose … but these are rather bland definitions that miss the essence in my opinion. Fundamentally, stratigraphy asks the question: how is time recorded in sedimentary rocks? When you look at a succession of sedimentary rocks you are looking at a record of the Earth’s surface through time. If you’re interested in paleobiology or Earth history, for example, understanding how the passage of time is recorded in those rocks is critical. Ideally we would use absolute dating techniques to date every single layer of sediment. Since we can’t do that yet (that’s a challenge to the geochronologists), we need to make inferences and interpretations about the passage of time from the characteristics of the rocks^.
–
BASELEVEL
Barrell’s paper is one in a long lineage of published works that contribute to the development of the field of stratigraphy we know today. If you’ve read Theoretical Stratigraphy #1, this passage should sound familiar:
The deposition of nearly all sediments occurs just below the local baselevel, represented by wave base of river flood level, and is dependent on upward oscillations of baselevel or downward oscillations of the bottom, either of which makes room for sediments below baselevel.
Note that Barrell attributes baselevel to a single geomorphic level — in this case, wave base of river flood (see first post for more on baselevel). You’ll also note the definition for what stratigraphers now term accommodation, which is simply the space available for sediment to accumulate. You’ll hear stratigraphers talk about systems with high or low accommodation, fluctuations in accommodation, and so on. One of the most intuitive, and thus oft-cited, examples of accommodation change is attributed to changes in sea level. When sea level goes up, for example, accommodation on the shelf increases. That is, there’s more room for marine sediments to accumulate. Changes in sea level have certainly had a huge impact on the stratigraphic record; however, I would caution against jumping to that conclusion in all cases. But that’s a topic for another day.
–
COMPOSITE CURVES AND RHYTHMS
So, Barrell discusses baselevel and accommodation, but the aspect of the paper I wanted to highlight for this post is his discussion of, as he puts it, the rhythms of geologic time as recorded in sedimentary rocks. As far as I know (please correct me if I’m wrong) Barrell was the first to explicitly discuss composite rhythms within the context of what’s preserved in the stratigraphic record.
The concept of composite rhythms is explained by Barrell with this statement:
Nature pulsates with many rhythms, small and large, fast and slow. Their combination gives a varied curve which, if the rhythms are incommensurable in period, may never recur in quite the same combination.
Even better, this is illustrated in the key figure from Barrell’s paper below (click on it for a bigger version). The vertical axis represents baselevel and the horizontal axis is time. Barrell is combining three curves of different wavelengths and amplitudes into one composite curve (by the way, if you’ve taken a stratigraphy or sequence stratigraphy class, this figure should look familiar; it has been reproduced many times over the years).
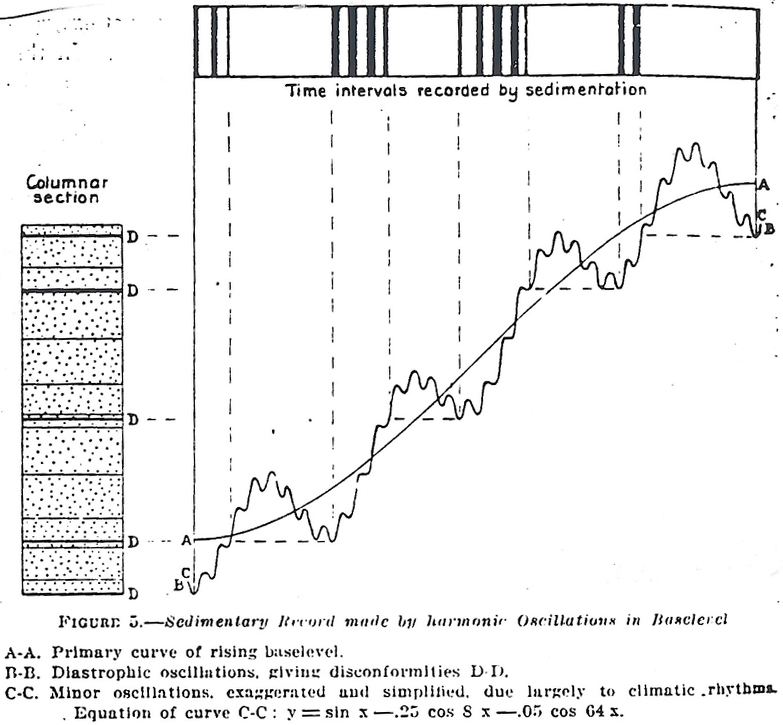
The concept of composite curves, in general, was not new in 1917. But, Barrell applies it directly to processes of sedimentation and preservation. He shows a generic stratigraphic column on the left side of the figure. On the top of the image, he’s showing which time intervals are actually recorded by sediment accumulation (with the vertical black bars). Remember, this is a theoretical example in which sedimentation (and preservation of sediment) occurs during the times of maximum baselevel rise on the composite curve. Note how the black bars at the top are clustered (bounded by dashed lines) during the rising limb of the intermediate curve. And then each individual black bar is tied to the highest frequency curve. The idea of preservation on the rising limb of a baselevel curve was later tested quantitatively with numerous and broad-ranging modeling efforts (see Paola, 2000; Sedimentology, v. 47 for a great review of the history and types of modeling in stratigraphy research). Conceptually, this idea is still generally accepted in the stratigraphy community.
Barrell’s top figure illustrates the inherent spasmodicity of sedimentation and preservation – it occurs in fits and starts. Those fits and starts occur across a broad range of time scales. Although Barrell illustrates this idea with the composite curve of three distinct ‘frequencies’, he addresses complexity within a continuum:
The curve, to correspond to nature, should be imagined as less regular and with more orders of rhythm.
In other words, each component curve would be much more erratic and there would be many more of them. More recent research has attempted to address this from interpretations from natural systems and results from modeling. If you’ve read this far, you might be wondering what the origins of these theoretical curves are.
–
WHERE DOES THE RHYTHM COME FROM?
So, if oscillations in baselevel control stratigraphic packaging, what controls oscillations in baselevel? Back in the beginning of this post, I mentioned how Barrell cited climate and tectonics as two major controls on the rhythms of sedimentation. Barrell briefly discusses origins of climate rhythms:
Another method [of investigation] is that of the detection of rhythms in parts of the sedimentary series, and the correlation of these rhythms with known climatic cycles.
He then talks about the climate cycles as a function of orbital precession and solar energy — Milankovitch cycles essentially. This is around the same time that Milanković, himself, published work related to these cycles. It might be interesting from a history of science perspective to try and track the development of the ideas within the context of who published what and when.
Many small oscillations and some of even larger magnitude are, however, dependent upon climatic change.
I’m not going to go into an exhaustive review of climate and sedimentation in this post. There are numerous papers and parts of textbooks that go into that topic in more detail#. We still don’t have a good handle on how exactly climatic rhythms translate into stratigraphy. While there may be cases where physical patterns in sedimentary successions do “match” with temporal patterns of climate variability (e.g., varved sediments interpreted as product of Milankovitch cycles), most depositional environments likely have a complex suite of intermediary processes that result in a low signal-to-noise ratio, so to speak, as a result of varying types of processes and timescales.
Investigating the relationship of process-response in sedimentary systems is still an active and vibrant area of research. One of the purposes of this post is to show that these ideas have been around for quite a while. It is fascinating to read a paper like Barrell’s because it can more clearly reveal the state of current research. If you’re interested in this field, I definitely recommend reading this paper for some important historical context.
–
* Unfortunately, I do not have a digital copy of this paper, only a slighly tattered and poor-quality photocopy version. If anyone finds a link to a digital version somewhere, please put link in comments below
^ Check out a great book about stratigraphy that is written in relatively non-technical language called The Nature of the Stratigraphical Record by Derek Ager. It is a fairly short read with a playful and quite enjoyable tone.
# A text by Andrew Miall called The Geology of Stratigraphic Sequences is just one of many good references. Please comment below about others that you like.
~~~~~~~~~~~~~~~~~~~~~~~~~~~~~~~~~~~~~~~~~~~~~~~~~~~~~~~~~~~~~~~~~~~~~~~~~~~~~~~
Growth of Daisetta sinkhole has stopped
At the time of this post (noon Pacific time, Fri 5/9), it appears the growth of a sinkhole in Daisetta, Texas has stopped. A recent news report states:
The massive sinkhole managed to swallow up oil tanks, barrels, tires, telephone poles and several vehicles after it began as a 20-foot hole in the ground on Wednesday. By Thursday, it had grown to 900 feet (275 m) across and 260 feet (80 m) deep. A geologist said late Thursday that it appeared the hole’s growth had stopped.

People are so curious about the feature that they’ve had to threaten arrest to trespassers and are now bringing small groups to view it.
At a press conference on Friday, … Liberty County Sheriff’s Department said that residents of Daisetta would be allowed to see the hole in groups of 25 in an attempt to stop the curious from wandering near the sight. [They] warned that people who try to get down to the sinkhole on their own, could be arrested.

I can’t lie … I’d like to go view the feature (from a safe vantage) just for the geologic experience.
UPDATE:
The video below (from AP’s channel on YouTube is a short report summarizing the information I mention above:
UPDATE UPDATE:
Check out this report from May 10, 2008, which discusses possible causes:
A company that sits near the edge of a massive sinkhole in Southeast Texas has been accused of violating permits for disposal of saltwater, which some geologists suggest may have caused the crater.
~~~~~~~~~~~~~~~~~~~~~~~~~~~~~~~~~~~~~~~~~~~~~~~~~~~~~~~~~~~~~~~~~~~~~~~~~~~~~~~~~~~
Today’s Friday Field Foto is from the Cretaceous of Utah and is a nice example of a type of cross stratification called swaley cross stratification. The key to recognizing this type of sedimentary structure is that the angle of the laminae decrease upwards. In the photo below, you’ll notice the very obvious scour surface cutting down through roughly horizontal laminae. The fill of that depression has sandy laminae that start off steep and then systematically decrease in steepness upwards. I will admit that this criterion is not always foolproof … you can sometimes get tricked by the cut of the outcrop and such. In this case, you’ll have to take my word for it as there were plenty of examples in this stratigraphic section.
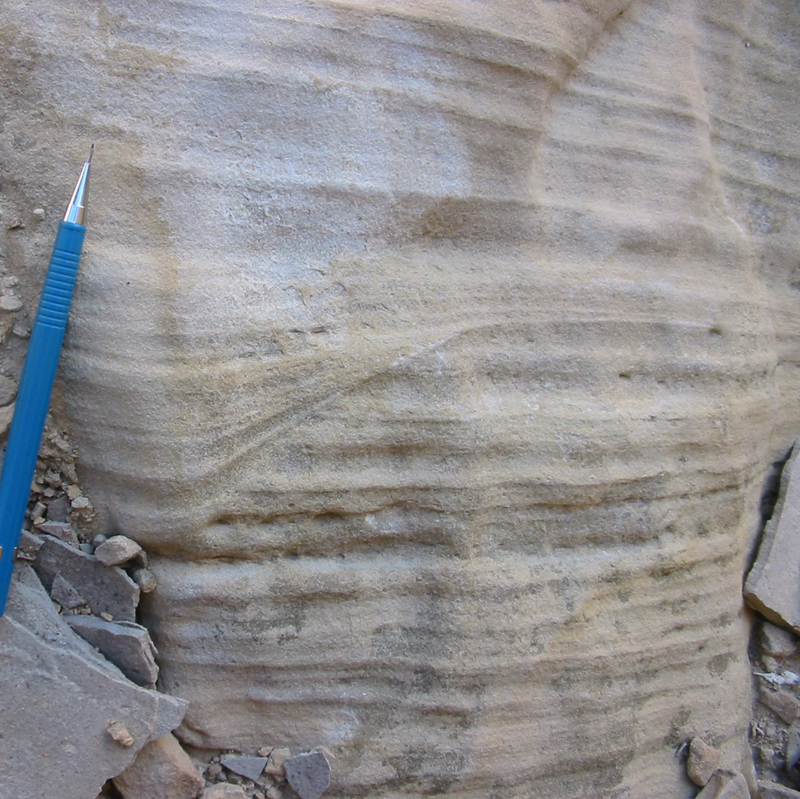
This sedimentary structure is thought to be a product of a combination of both bedload sediment transport and sediment falling out of suspension. Reworking and resuspension of sand as a result of vigorous storm waves are a common interpretation of swaley cross-stratified sandstone. Another structure that is, in a way, the inverse of this – a mounded structure, called hummocky cross-stratification – can be quite common in close stratigraphic association (to see a nice example of hummocky bedding, check out front page of The Dynamic Earth blog).
Happy Friday!
~~~~~~~~~~~~~~~~~~~~~~~~~~~~~~~~~~~~~~~~~~~~~~~~~~~~~~~~~~~~~~~~~~~~~~~~~~~~~~~~~~
Daisetta sinkhole
While the eruption of Chaitén volcano in Chile is certainly worthy of grabbing the geo-headlines this week, there is another developing geological feature of interest.
I’ve had two friends alert me (thanks!) to some information about a rapidly-developing sinkhole in Daisetta, Texas (a bit northeast of Houston). As of this morning it was ~400 m in diameter and ~60 m deep.
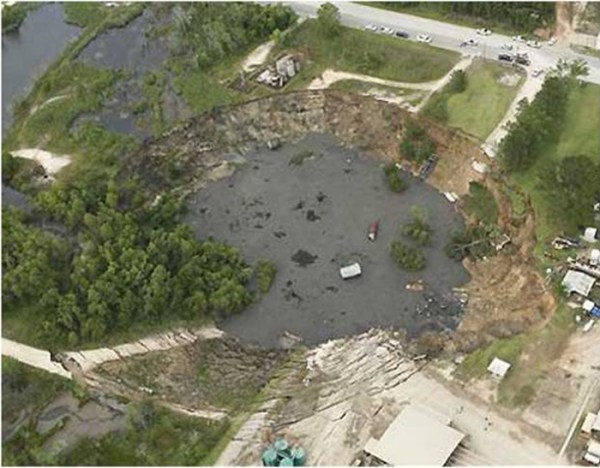
You can get a sense of the scale of the sinkhole from the photo above (from this article). Geologists preliminarily think this is likely related to collapse of salt domes in the subsurface. At the time of writing this post, those on the scene believe it’s growth is slowing down a bit. At one point it was deeping as much as 20 ft (6 m) per hour.
See update post here.
UPDATE UPDATE:
Check out this report from May 10, 2008, which discusses possible causes:
A company that sits near the edge of a massive sinkhole in Southeast Texas has been accused of violating permits for disposal of saltwater, which some geologists suggest may have caused the crater.
–
As a friend mentioned to me, an event like this stirs up memories of the famous Lake Peigneur incident, which I blogged about here.
~~~~~~~~~~~~~~~~~~~~~~~~~~~~~~~~~~~~~~~~~~~~~~~~~~~~~~~~~~~~~~~~~~~~~~~~~~~~~~
