NOAA + USGS = ESSA
This intriguing press release just came across my reader.
Here are a few blurbs from the release … I need to think some more about this.
In an article published in the journal Science, a group of former senior federal officials call for the establishment of an independent Earth Systems Science Agency (ESSA) to meet the unprecedented environmental and economic challenges facing the nation. They propose forming the new agency by merging the National Oceanic and Atmospheric Administration (NOAA) and the U.S. Geological Survey (USGS).
My intitial gut reaction, for better or for worse, is that a combination of that sort would result in diminishing the component agencies signficantly. But, like I said … that’s just my gut … it is often wrong.
Groat points to the breadth of capabilities the agency would possess. “The USGS, in bringing not only its geologic, biologic, hydrologic and geospatial expertise to the understanding of natural systems, but also its research capabilities in energy, mineral, water, and biologic resources, gives the new organization a comprehensive perspective on both environmental and resource systems. If we effectively link these capabilities with those of NOAA, we will have a powerful research institution,” he says.
That’s true. But, why is a merger necessary to create better linkage?
Hmmm … I need to stew on this a bit more … anyone have any thoughts?
~~~~~~~~~~~~~~~~~~~~~~~~~~~~~~~~~~~~~~~~~~~~~~~~~~~~~~~~~~~~~~~~~
Instead of the usual bathymetric image, this week’s Sea-Floor Sunday highlights some photographs of the sea floor in deep water.
The photographs below are from a 2007 paper by Piper et al. in the journal Paleogeography, Paleoclimatology, Paleoecology* about the Laurentian submarine channel and fan system, which is offshore of Newfoundland and Nova Scotia, eastern Canada. The paper is titled “Stratigraphic and sedimentological evidence for late Wisconsinan sub-glacial outburst floods to Laurentian Fan”. Very cool stuff.

The photographs are taken by the manned submersible Alvin … how awesome would that be!
What you’re looking at are likely Pleistocene-aged turbidite deposits that are now exposed in an ‘outcrop’ on the sea floor. Subsequent turbidity currents have come down the submarine valley and eroded and sculpted the seascape leaving some remnant older deposits.
This Geological Survey of Canada site shows the evolution of the onshore and continental shelf areas from the Last Glacial Maximum (~20,000 yrs ago) and during subsequent sea-level rise as the ice sheets melted (~12,000 yrs ago).
–
* That’s right … I took the extra (and unnecessary) “a” out of those words … I was recently forced to change a bunch of words to the “British” version to get a paper published. Spelling them the way I want to on my own blog is my only way of stickin’ it to the British man! :)
~~~~~~~~~~~~~~~~~~~~~~~~~~~~~~~~~~~~~~~~~~~~~~~~~~~~~~~~~~~~~~
podClast #6 is up!
In case you missed it … the sixth edition of the podClast is up and ready for your listening pleasure. The podClast is an informal discussion among geobloggers about geoscience-related topics that are making headlines (sometimes in the mainstream press and sometimes just in geo-nerd circles). Here is the rundown of this week … taken from the show notes page:
This week’s show discusses opening up the untapped oil reserves of the U.S.A, the June 14th Japanese earthquake and the early warning system, and the recent flooding in the mid-west of the U.S.
Participants
Chris – goodSchist
Brian – Clastic Detritus
Jess (Tuff Cookie) – Magma Cum Laude
I had some connectivity issues with Skype during this … but you wouldn’t know it by listening to it. Chris did a masterful job at editing.
Want to join in? Find out the details here.
–
Speaking of science podcasts, this week’s Nature podcast is unusually rich in geoscience topics. They discuss (1) ideas about how the crustal dichotomy on Mars may be a result of a large impact, (2) more about the effects of impacts within the context of the 100 year anniversary of the Tunguska event, and (3) explosive volcanism in the deep sea. You can see the transcript and get the audio here.
~~~~~~~~~~~~~~~~~~~~~~~~~~~~~~~~~~~~~~~~~~~~~~~~~~~~~~~~~~~~~~~~~~~~
Friday Field Foto #57: Dish structures
A relatively common sedimentary structure found in sandstone turbidite beds are dish structures. Take a look at the photo below and you’ll see why they are called that … they are concave-up, slightly darker laminations anywhere from a centimeter to a few 10s of cm across. Sometimes they are less arcuate (platters) and sometimes the concavity is more pronounced (cups).

How do these form? If you want to learn about what these structures are, how they form, and what they can tell us about the sedimentation mechanics go check out Hindered Settling’s fantastic post on this subject. I can’t say it any better than that post, so go there. Plus, he has some beautiful photos of more exquisite examples. Check it out.
As a side note, this paper from 1972 notes the first time dish structures were recognized and reported in the literature:
Dish structure was first described by Wentworth (1967) from the Gualala Formation of northern California…
As it turns out, the photograph above is from the Gualala Formation! Maybe Wentworth went to this exact spot … that would be cool.
Happy Friday!
~~~~~~~~~~~~~~~~~~~~~~~~~~~~~~~~~~~~~~~~~~~~~~~~~~~~~~~~~~~~~~~~~~
Satellite image of California wildfires
Nov 2008 — If you found yourself here searching for images of the November 2008 wildfires in the Santa Barbara area, check out these maps.
–
I just saw this image over at geology.com/news and had to post it (original source from Earth Observatory website).
There are literally hundreds of fires burning at once. Although there are no fires directly threatening where I live, we woke up smelling smoke this morning.

The next image below, zooms in a bit.

Read more about the fires here.
UPDATE: Also see this GoogleMaps version of the current fires (again, as seen on geology.com/news).
UPDATE2: EarthObservatory has updated satellite images here.
~~~~~~~~~~~~~~~~~~~~~~~~~~~~~~~~~~~~~~~~~~~~~~~~~~~~~~~~~~~~~~~~~~~~~
Papers I’m reading – June 2008
It’s been difficult lately to find the time to write detailed (and hopefully good) posts about recent papers in sedimentary geology. I’m going to start a new monthly series where I simply list a few to several papers that I have on my desk and plan to read. Some may be of interest to you … some, not so much. It’s just a list.
These will mostly be of interest to sedimentary geologists, but, since I receive Geology, there will be some “general interest” papers too. Most of the time, they will be brand new or a couple months old, but I also like digging into the past and reading old papers from time to time.
Okay … so here we go, here’s the list for June 2008:
- Trofimovs, J., Sparks, R.S.J., and Talling, P.J., 2008, Anatomy of a submarine pyroclastic flow and associated turbidity current: July 2003 dome collapse, Soufriere Hills volcano, Montserrat, West Indies: Sedimentology, v. 55, p. 617-634 [link].
- Varban, B.L. and Plint, A.G., 2008, Sequence stacking patterns in the Western Canada foredeep: influence of tectonics, sediment loading and eustasy on deposition of the Upper Cretaceous Kaskapau and Cardium Formations: Sedimentology, v. 55, p. 395-421 [link].
- Aziz, H.A. et al., 2008, Astronomical climate control on paleosol stacking patterns in the upper Paleocene–lower Eocene Willwood Formation, Bighorn Basin, Wyoming: Geology, v. 36, no. 7, p. 531-534 [link].
- Christoffersen, P., et al., 2008, Large subglacial lake beneath the Laurentide Ice Sheet inferred from sedimentary sequences: Geology, v. 36, no. 7, p. 563-566 [link].
- Hill, J.C., et al., 2008, Iceberg scours along the southern U.S. Atlantic margin: Geology, v. 36, no. 6, p. 447-450 [link]. NOTE: This one has some great bathymetric images!
- Michel, J., et al., 2008, Incremental growth of the Patagonian Torres del Paine laccolith over 90 k.y.: Geology, v. 36, no. 6, p. 459-462 [link].
Unfortunately, the links require subscription to get full access … I know that’s a bummer for many, not much I can do about that.
Please feel free to comment below about what you’re reading from the literature or link to your own list.
~~~~~~~~~~~~~~~~~~~~~~~~~~~~~~~~~~~~~~~~~~~~~~~~~~
This week’s Sea-Floor Sunday is a quick one.
A paper came out in Marine Geology last month (v. 250, p. 258-275) about a methane-seeping, actively-growing sea-floor mound in Santa Monica Basin (offshore Los Angeles, CA).
It’s like a zit on the sea floor!!
In the perspective bathymetric image below, note the depth scale (colors) and the distance scale (in red by bottom of image). This is a big zit!
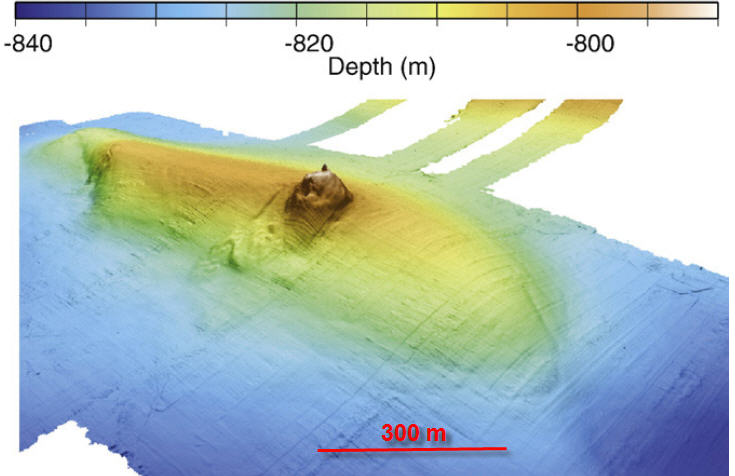
What’s more is that the mound hosts a biologic community … a chemosynthetic community of organisms. In addition to the mapping and profiling of the feature, they also took some photographs and did some sampling of the mound. Very cool stuff.
The first author is a marine geologist from the Monterey Bay Aquarium Research Institute (MBARI) … they have a fantastic website about all the geologic and biologic research they do in the deep sea and submarine canyons. Check it out here.
~~~~~~~~~~~~~~~~~~~~~~~~~~~~~~~~~~~~~~~~~~~~~~~~~~~~~~~~~~~~~~~~~~~~~~~~~~~~
This blog has moved to Wired Science (as of Sept 14, 2010)
URL: http://www.wired.com/wiredscience/clasticdetritus/
RSS: http://www.wired.com/wiredscience/category/clastic-detritus/feed
–
UPDATE (3/31/2010): You may have found yourself here today because of the announcement from the Obama administration to open up drilling along parts of the Atlantic coast. The post below is nearly two years old now, but the MMS (Minerals Management Service) 2006 assessment is still the most recent assessment of recoverable resources that I know of. Please point me to a more recent one if you know of one. This announcement will undoubtedly create a lot of discussion so it’s good to be aware of how much resources is estimated to be in these locations.
–
UPDATE (7/31/2008): I wrote this post over a month ago and it is still getting a lot of traffic. If you’d like some more recent information please check out this article from the Energy Information Administration. They estimate even less oil than the 2006 MMS report I discuss below. Furthermore, the article estimates the impact on production rates if the OCS resources became available, which is really the crux of the issue — total domestic production of crude oil from 2012 to 2030 is projected to be 1.6% higher in this case. There’s a decimal point in there … that’s less than a 2% increase in production.
~
As you most certainly are aware, there was a lot of news reports and jibber-jabber this week in the United States about lifting the ban on offshore drilling for oil and gas. A real discussion about this has been going on for years, but this latest flurry to make the news cycle stems from statements by Bush and McCain (along with other Republican lawmakers) that lifting the ban on offshore drilling in national waters would be beneficial for a slumping economy. Essentially, their argument is that gasoline prices will go down if we lift the drilling ban. Another version of the argument is that gasoline prices would not be as high as they are now if we had lifted the ban at some point in the past.
I’ll get to what I think about these arguments later in the post … but first I want to lay out some facts and figures. Knowledge is indeed power and these are great stats to have at your fingertips.
–
What is the OCS?
Much of discussion is about the moratorium on drilling for petroleum resources in The Outer Continental Shelf, or the OCS, areas of the United States, which consists of:
…the submerged lands, subsoil, and seabed, lying between the seaward extent of the States’ jurisdiction and the seaward extent of Federal jurisdiction.
The above definition is directly from the Minerals Management Service (MMS) website. The MMS is the primary federal agency responsible for managing the OCS.
Since this is a geology blog, I can’t help but comment … you’ll notice in the map below that, although the OCS name has the term “continental shelf” in it, these regions do not correspond to the actual physiographic/geologic continental shelves (in terms of water depth and type of crust). The OCS boundaries for the rifted Atlantic margin might be close, but the Pacific margin, being all subducty and transformy, generally has very narrow (10s of km) continental shelves. But I digress.
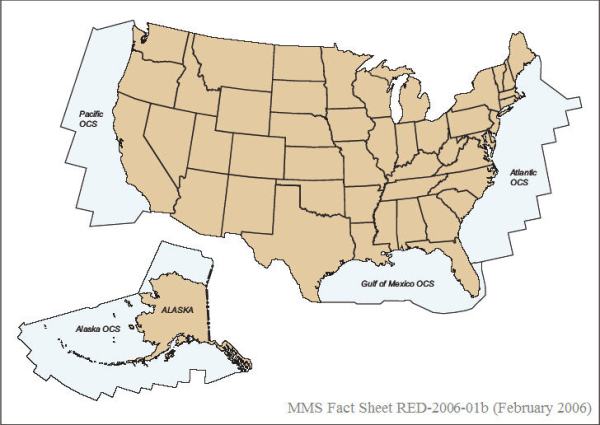
The map above is from a 2006 report by the MMS titled “Assessment of Undiscovered Technically Recoverable Oil and Gas Resources of the Nation’s Outer Continental Shelf”, which you can get here. Another area that gets a lot of press in this debate is the Arctic National Wildlife Refuge (ANWR). I’m going to have to tackle that another time … for this post, I will focus on the OCS. Note: Chris over at goodSchist.com has a nice post about ANWR.
–
The Ban on Drilling for Oil & Gas in the OCS
When I started researching this post, I realized I didn’t really know the history of the drilling moratorium. Most other developed countries have decided to drill and produce the petroleum resources in their offshore regions, which has led to significant revenue for some (e.g., Norway is one of the richest and most prosperous countries in Europe for a reason).
The United States Congress established a moratorium for drilling the offshore regions (with the exception of parts of the Gulf of Mexico, parts of Alaska’s North Slope, and parts of southern California) in 1981. Although this is referred to all over the place, I could not find the original congressional documents (if you can, please link to in comments below). I also could not find any vintage news reports about what exactly prompted this and why in 1981. Please educate me if you remember (I was playing with Star Wars action figures at the time and not really paying much attention to the Congressional activities).
UPDATE: A fellow blogger kindly looked up some references about the history of the OCS drilling moratorium. Check out these links over at Looking for Detachment.
–
How Much Oil Does the OCS Have?
Before talking about whether or not increased oil supply from the OCS and its impact on prices, it’s good to get a handle on just how much oil we can expect to find and produce. Below is Table 1 from the 2006 MMS resource assessment for undiscovered technically recoverable* oil and gas resources in the OCS regions. Reviewing the methods of calculation and determination of resources is way beyond the scope of this post. For the sake of discussion, let’s assume their numbers are correct.
The numbers are divided into oil (in billions of barrels) and natural gas (in trillions of cubic feet). For now, let’s focus on oil – I’ve circled in red the total of all four regions, which comes to 86 billion barrels of oil.

Dang … that is a lot of oil!!
Or, is it? Here’s an ultra-simplified back-of-the-envelope calculation:
> Amount of oil that could be produced from offshore U.S. = 86 billion barrels
> Amount of oil consumed per day in U.S.^ = 20.7 million barrels
> How long it would take that oil to be consumed = 11 years
If you incorporate the low and high estimates, then it would be 9 and 15 years, respectively. For the sake of argument, let’s go ahead and use the “optimistic” estimate that the OCS would give us 15 years worth of oil.
Just think of this as a different unit for oil … the volume unit is put into the context of time. Kind of like putting distance into time with the light-year unit. This doesn’t mean it will actually take 15 years to use it, it’s simply another way to visualize the amount. (Of course, unlike the speed of light, the consumption rate could certainly change, which would affect that calculation.) UPDATE3: Multiple readers/commenters have brought up the point that this ‘oil-years’ unit is misleading … I agree. I certainly don’t want anyone to cite Clastic Detritus as saying X billion barrels would last X years. It’s simply another way to visualize it. One would want to compare other resource assessments like this within that same ‘unit’.
–
How Long Until We Can Get That Oil?
Let’s assume the offshore drilling ban was lifted later today … just like that. Would the oil start flowing tomorrow? Of course not.
Firstly, there is currently a five-year backlog for offshore drilling rigs/ships. As other nations such as China and India start developing their offshore resources, the demand for drilling equipment as skyrocketed. Ship builders are answering the call by building more equipment but, as you might guess, building a vessel that can drill in 3,000 m of water and 8,000 m into the subsurface can’t be done on a weekend.
Secondly, drilling an exploration well is but one step in a long process of getting the resource to market. Depending on the depths and other geologic factors, just drilling a hole to test the hypothesis of the presence of oil could take several months. Then, the company, country, or joint-venture needs to decide whether or not to proceed with the project … sometimes they do, sometimes they don’t. If they do decide there’s enough oil to make the project economic then a development plan needs to be hammered out … those other wells need to be drilled. That’s just the drilling … we haven’t even gotten to the actual production facilities yet! You get the picture. Depending on water depths, distance from pipelines, and so on and so forth, getting an oil field online from time of discovery can take anywhere from a few years to more than a decade.
Thirdly, only a handful of fields would come online in, let’s be optimistic, a decade from now (2018). It’s not like those 86 billion barrels are all going to magically be delivered to the refineries all at once. It would take many decades to deliver that resource.
–
Commodity Trading and the Price of Oil
Another part of this discussion is the fact that oil is a commodity like any other and is traded on an open market. Fluctuations in price are driven by the interactions of the traders themselves. I would be way out of my bounds if I went any further down this path trying to explain the dynamics of commodities trading. I don’t have a deep understanding of how that all works.
Some argue that lifting the ban will “send a message” to the rest of the world that we are serious about increasing our own domestic supply, which will influence the commodities traders and thus the price. My intuition (for what it’s worth) is that it might drive the price down for a short time. Daily/weekly fluctuations in the price of oil do seem to be influenced by global events, economic announcements, and so on. But, over the long term (months to years), the price seems to be driven by basics of supply and demand.
–
Opportunism for Pro-Drilling Advocates
Finally … the op-ed part of the post!
It should be obvious to most, that the politicians who favor offshore petroleum resource development are citing the current high-gasoline-price situation as the main reason for why the drilling ban needs to be lifted. The argument is simple: lift the drilling ban > oil exporation/production occurs > oil supplies increase > gasoline prices go down.
There are several layers of complexity in this issue, but the two aspects that I’ve discussed in this post, the estimated amount of undiscovered oil and the time it would take to get it to market, are not mentioned by these politicians. Reporters, other bloggers, and, even more telling, those that actually work in this industry, have mentioned this:
As politicians debate whether to open federal offshore waters to oil and natural-gas drilling, there is agreement on at least one point: It isn’t a short-term fix.
If the bans were lifted tomorrow, it would be at least seven years — and likely as long as a decade — before the first oil began to flow off the coasts of Florida, California and the eastern seaboard.
“Is it going to happen overnight? No,” said Dan Naatz, vice president of the Independent Petroleum Association of America. “Is it going to solve all of our nation’s energy problems? No.”
That’s a report from The Wall Street Journal quoting the vice president of the Independent Petroleum Association of America (bold emphasis mine). These people actually work in the industry … they know what’s up.
McCain should know better, he should know the realities of the oil and gas industry … instead he’s pandering:
…[McCain] said his proposal would “be very helpful in the short term resolving our energy crisis.”
He’s specifically saying the “short term”. He’s not talking philosophically about energy independence in the 21st century or anything like that. He’s talking about right now. UPDATE: McCain has back-flopped, or flip-tracked, or something … he’s now saying that the short-term benefits of opening up drilling will be “psychological”. Okay, so no immediate economic benefits after all … darn. UPDATE2: U.S. government’s top energy forecaster says allowing drilling “would be a relatively small effect” on prices.
All of the sudden, lifting the ban on offshore drilling is the most important issue of the day for some conservatives (e.g., here). Now, let’s be clear … I’m not saying that allowing development and production of these resources wouldn’t impact our dependence on foreign oil in the long term. It most certainly would. My point is that implying that lifting the ban would somehow magically result in an immediate return to cheap (and sustained) gasoline prices is disingenuous. Moreover, if you do peruse the pro-drilling websites, you probably won’t find much quantification of undiscovered resources … just phrases like “vast amounts” and “a lot”. If long-term prices are indeed driven by supply-demand, to what degree will 15 oil-years affect global supply-demand dynamics?
The debate over whether or not to lift the ban should continue. It is an important debate because it will keep the overarching problem of energy in the forefront. When the drilling moratorium was enacted I presume it was primarily to protect areas from direct impacts of drilling and production – it was local to regional. Now, superimposed on the direct impacts, is the global problem of eventually burning those hydrocarbons for energy and its subsequent impact on the atmosphere.
My wild speculation prediction is that we will end up opening some areas to drilling over time. It certainly won’t be all at once … it will take decades and be done in a piecemeal fashion. And it’ll probably end up being way offshore to minimize coastal impacts (and the nimby effect). Why do I think this? Two words: dependence and demand. I recommend watching the 2006 documentary film A Crude Awakening. It is mostly about supply issues (i.e., peak oil), which is a topic for another day, but they also effectively communicate our dependence on oil. As we transform the way we power our world and our attitudes towards consumption (which I’m confident we will … because we have to), oil will still be a part of the mix … not the majority even, but a part.
–
Resource Nationalism
Finally, underlying all of the facts, figures, and opinions expressed above is the big-picture geopolitical aspects of resource nationalism. Most of the rest of the world’s nations have a state-owned oil company. When citizens of those countries say “our oil” it is an accurate statement. Even though the United States does not have a national oil company, I’m starting to hear people use the phrase “our oil” when discussing resources that happen to be within our borders. Is it not a free market? Can’t any other company, including other nation’s state-owned companies, come in and develop it if they win the bid in the lease sale? If so, can’t they then transport the resource away from the U.S. if they really wanted to? Why does lifting the ban on offshore drilling in the United States equate to more of “our oil”? Would Americans favor nationalization of oil resources if that meant lower prices?
Anyway … I only bring up this last point to stimulate some discussion. I haven’t studied the intricacies of this topic or what the potential ramifications would be in any detail. I just thought it was interesting to see the “our resources” meme spread throughout the commentary this week.
~
* “undiscovered technically recoverable resources”, or UTRR, refers to the amount of oil we can extract with current (or very near-future and foreseeable) technologies without taking economic feasibility into account
^ http://www.eia.doe.gov/basics/quickoil.html
~~~~~~~~~~~~~~~~~~~~~~~~~~~~~~~~~~~~~~~~~~~~~~~~~~~~~~~~~~~~~~~~~~~~
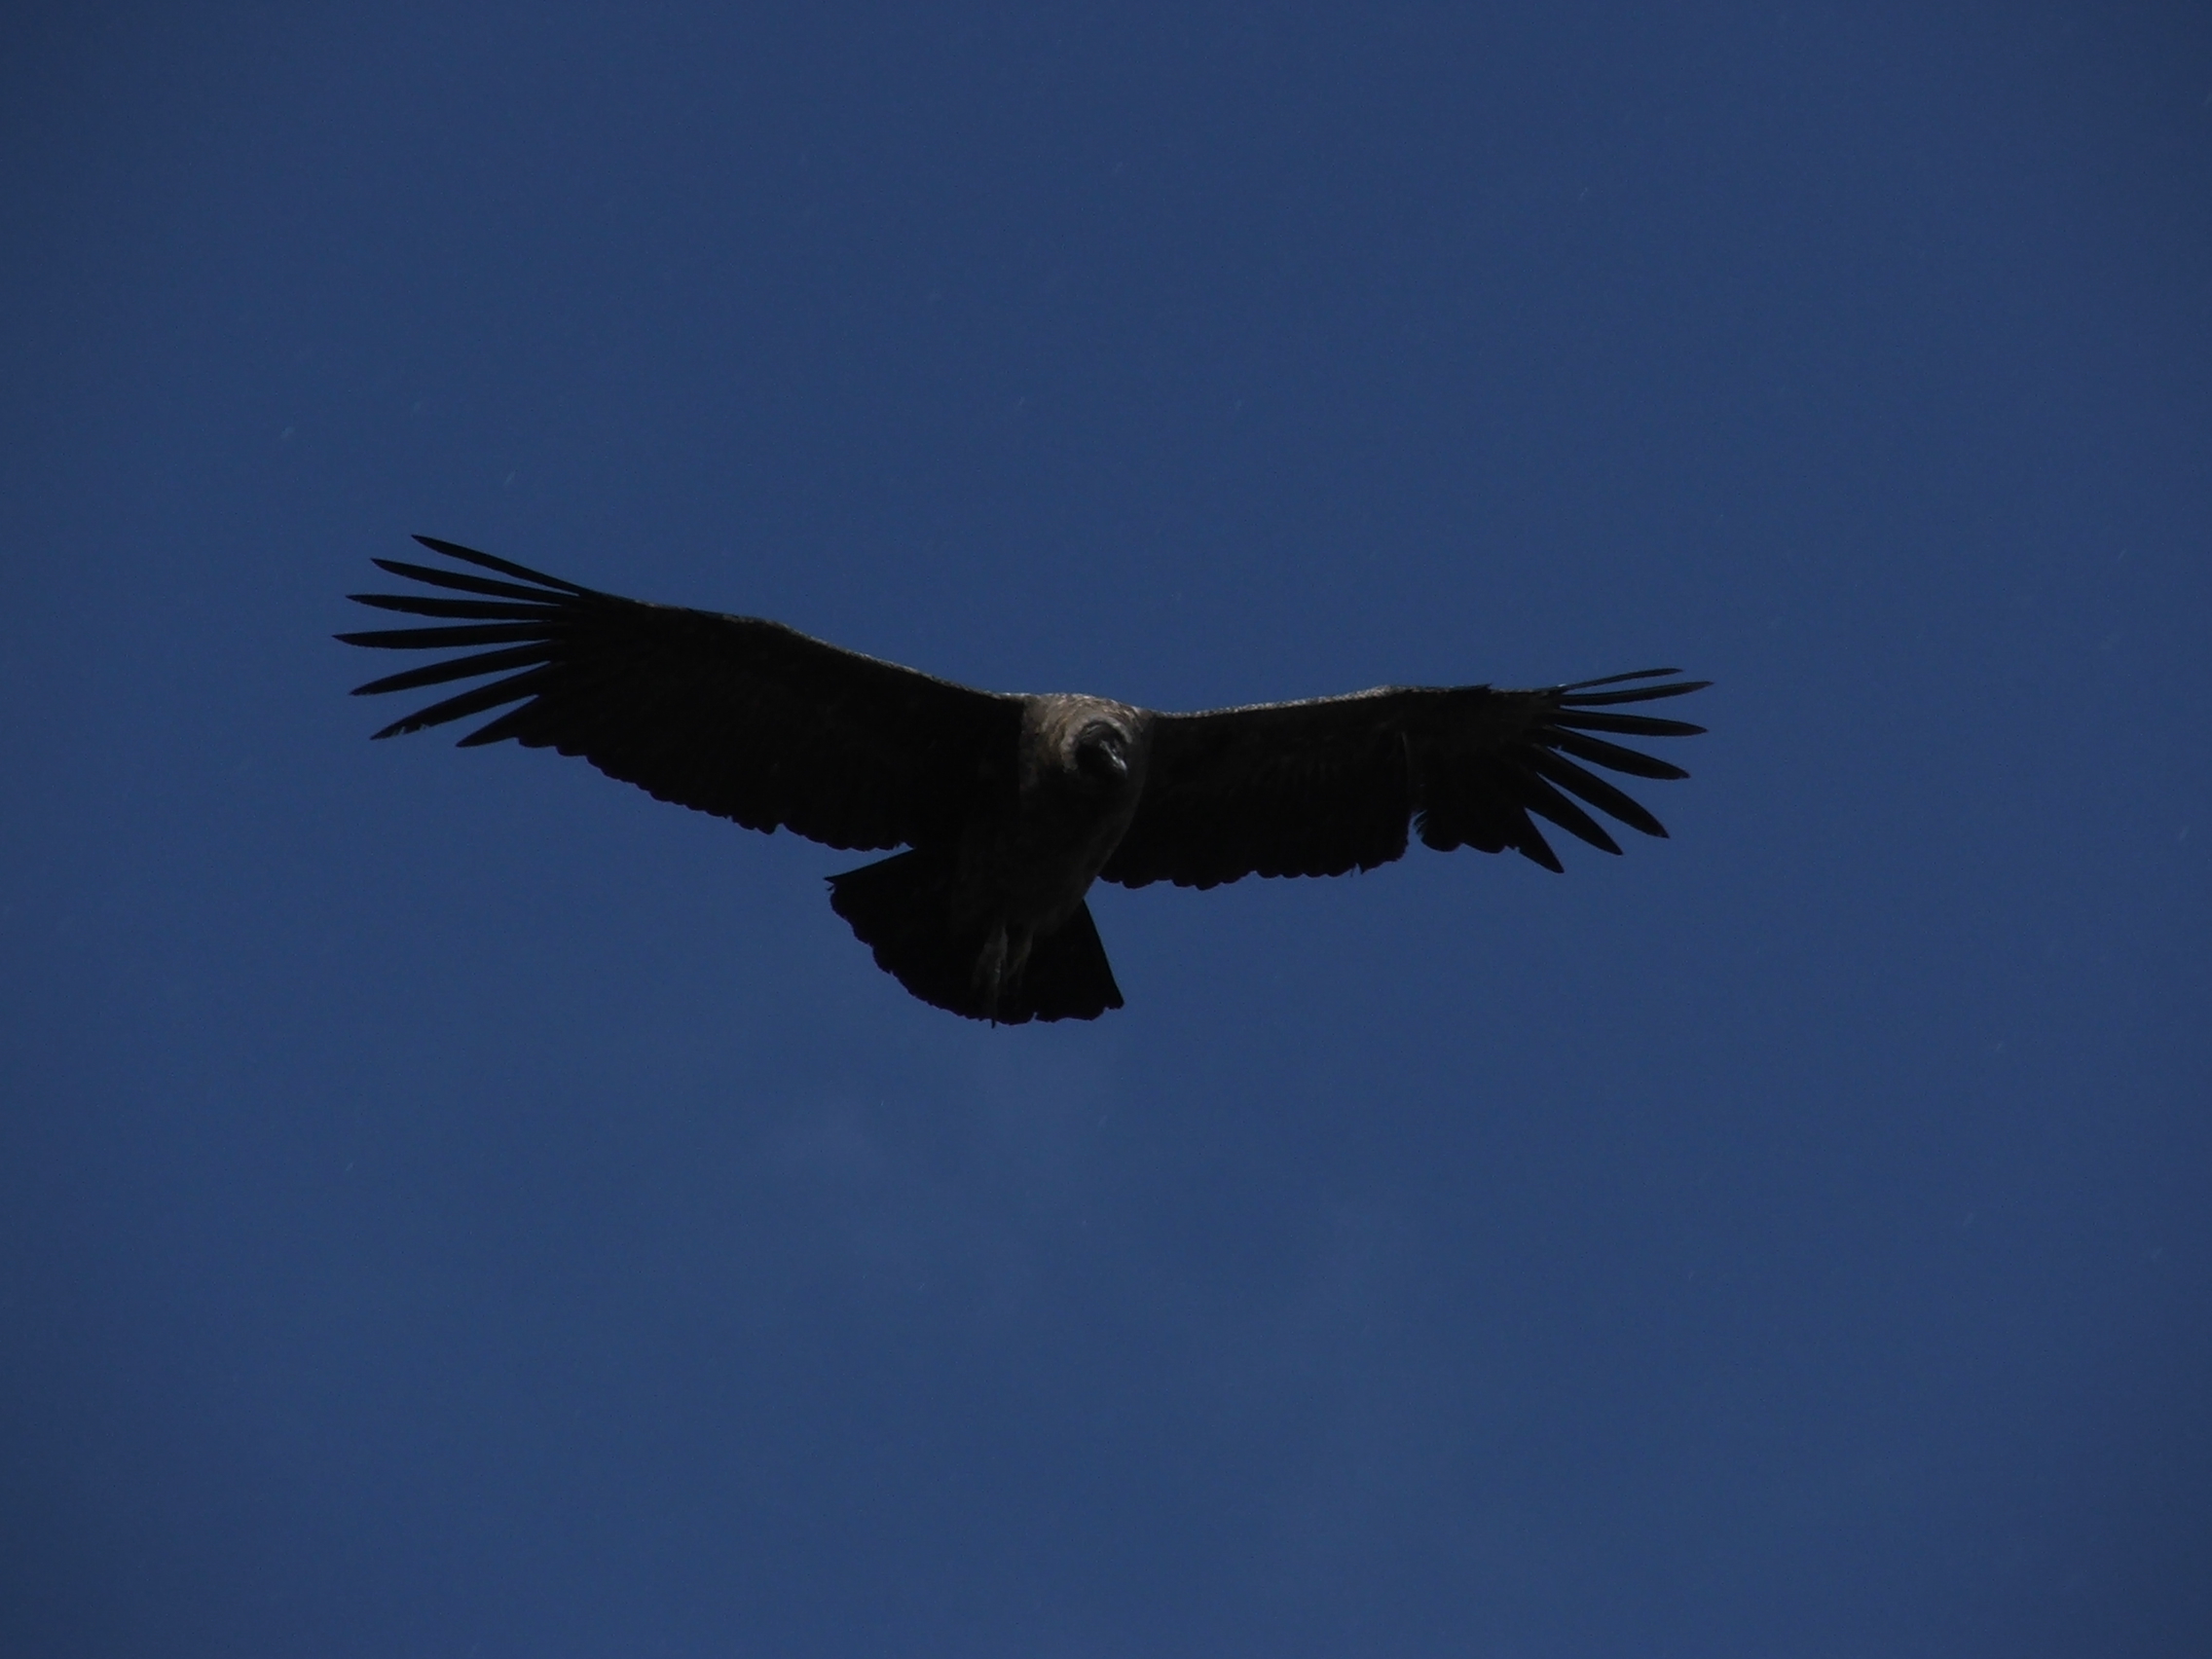
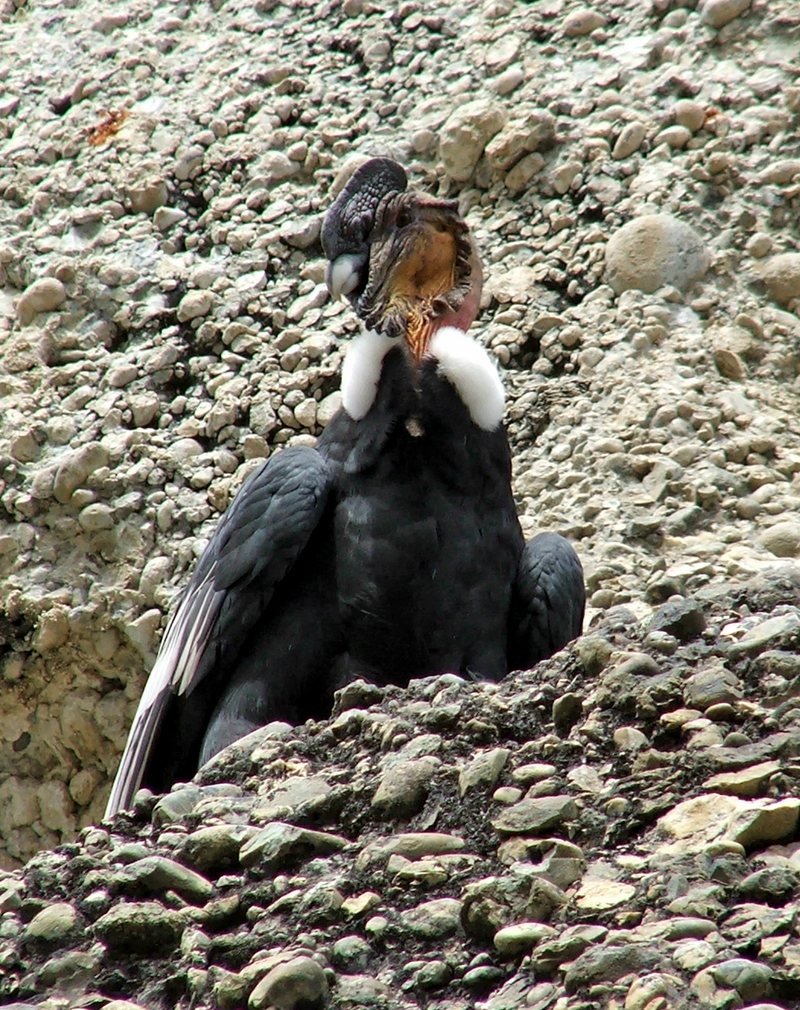
Friday Field Foto #56: Andean condor
Eric from The Dynamic Earth had a post earlier this week about animals encountered while in the field. That reminded me about some photographs of Andean condors from my work in Patagonia that I’ve been meaning to post.
The Andean condor is huge … wingspan can reach 3 m (10 ft). On average, this is longer than its North American cousin, the California condor (although they are longer from beak to tail).
Because Andean condors like to take advantage of rising warm air to soar, you typically find them along mountainsides and big vertical cliff faces. As it turns out, this is also where you can find geologists … that’s where the rocks are.
The photo below zooms in on one while it is flying … although it is difficult to get a sense of scale of the bird against the blue sky.
The next photo below was taken a little bit later that same day. Condors are scavengers, part of the vulture family, and often circle around you (presumably waiting for something bad to happen to you). Once one or two start circling, many more show up. It may be a bit tough to see in this photo, but there are about 10 or so in this shot. We ended up counting 25 at one point!
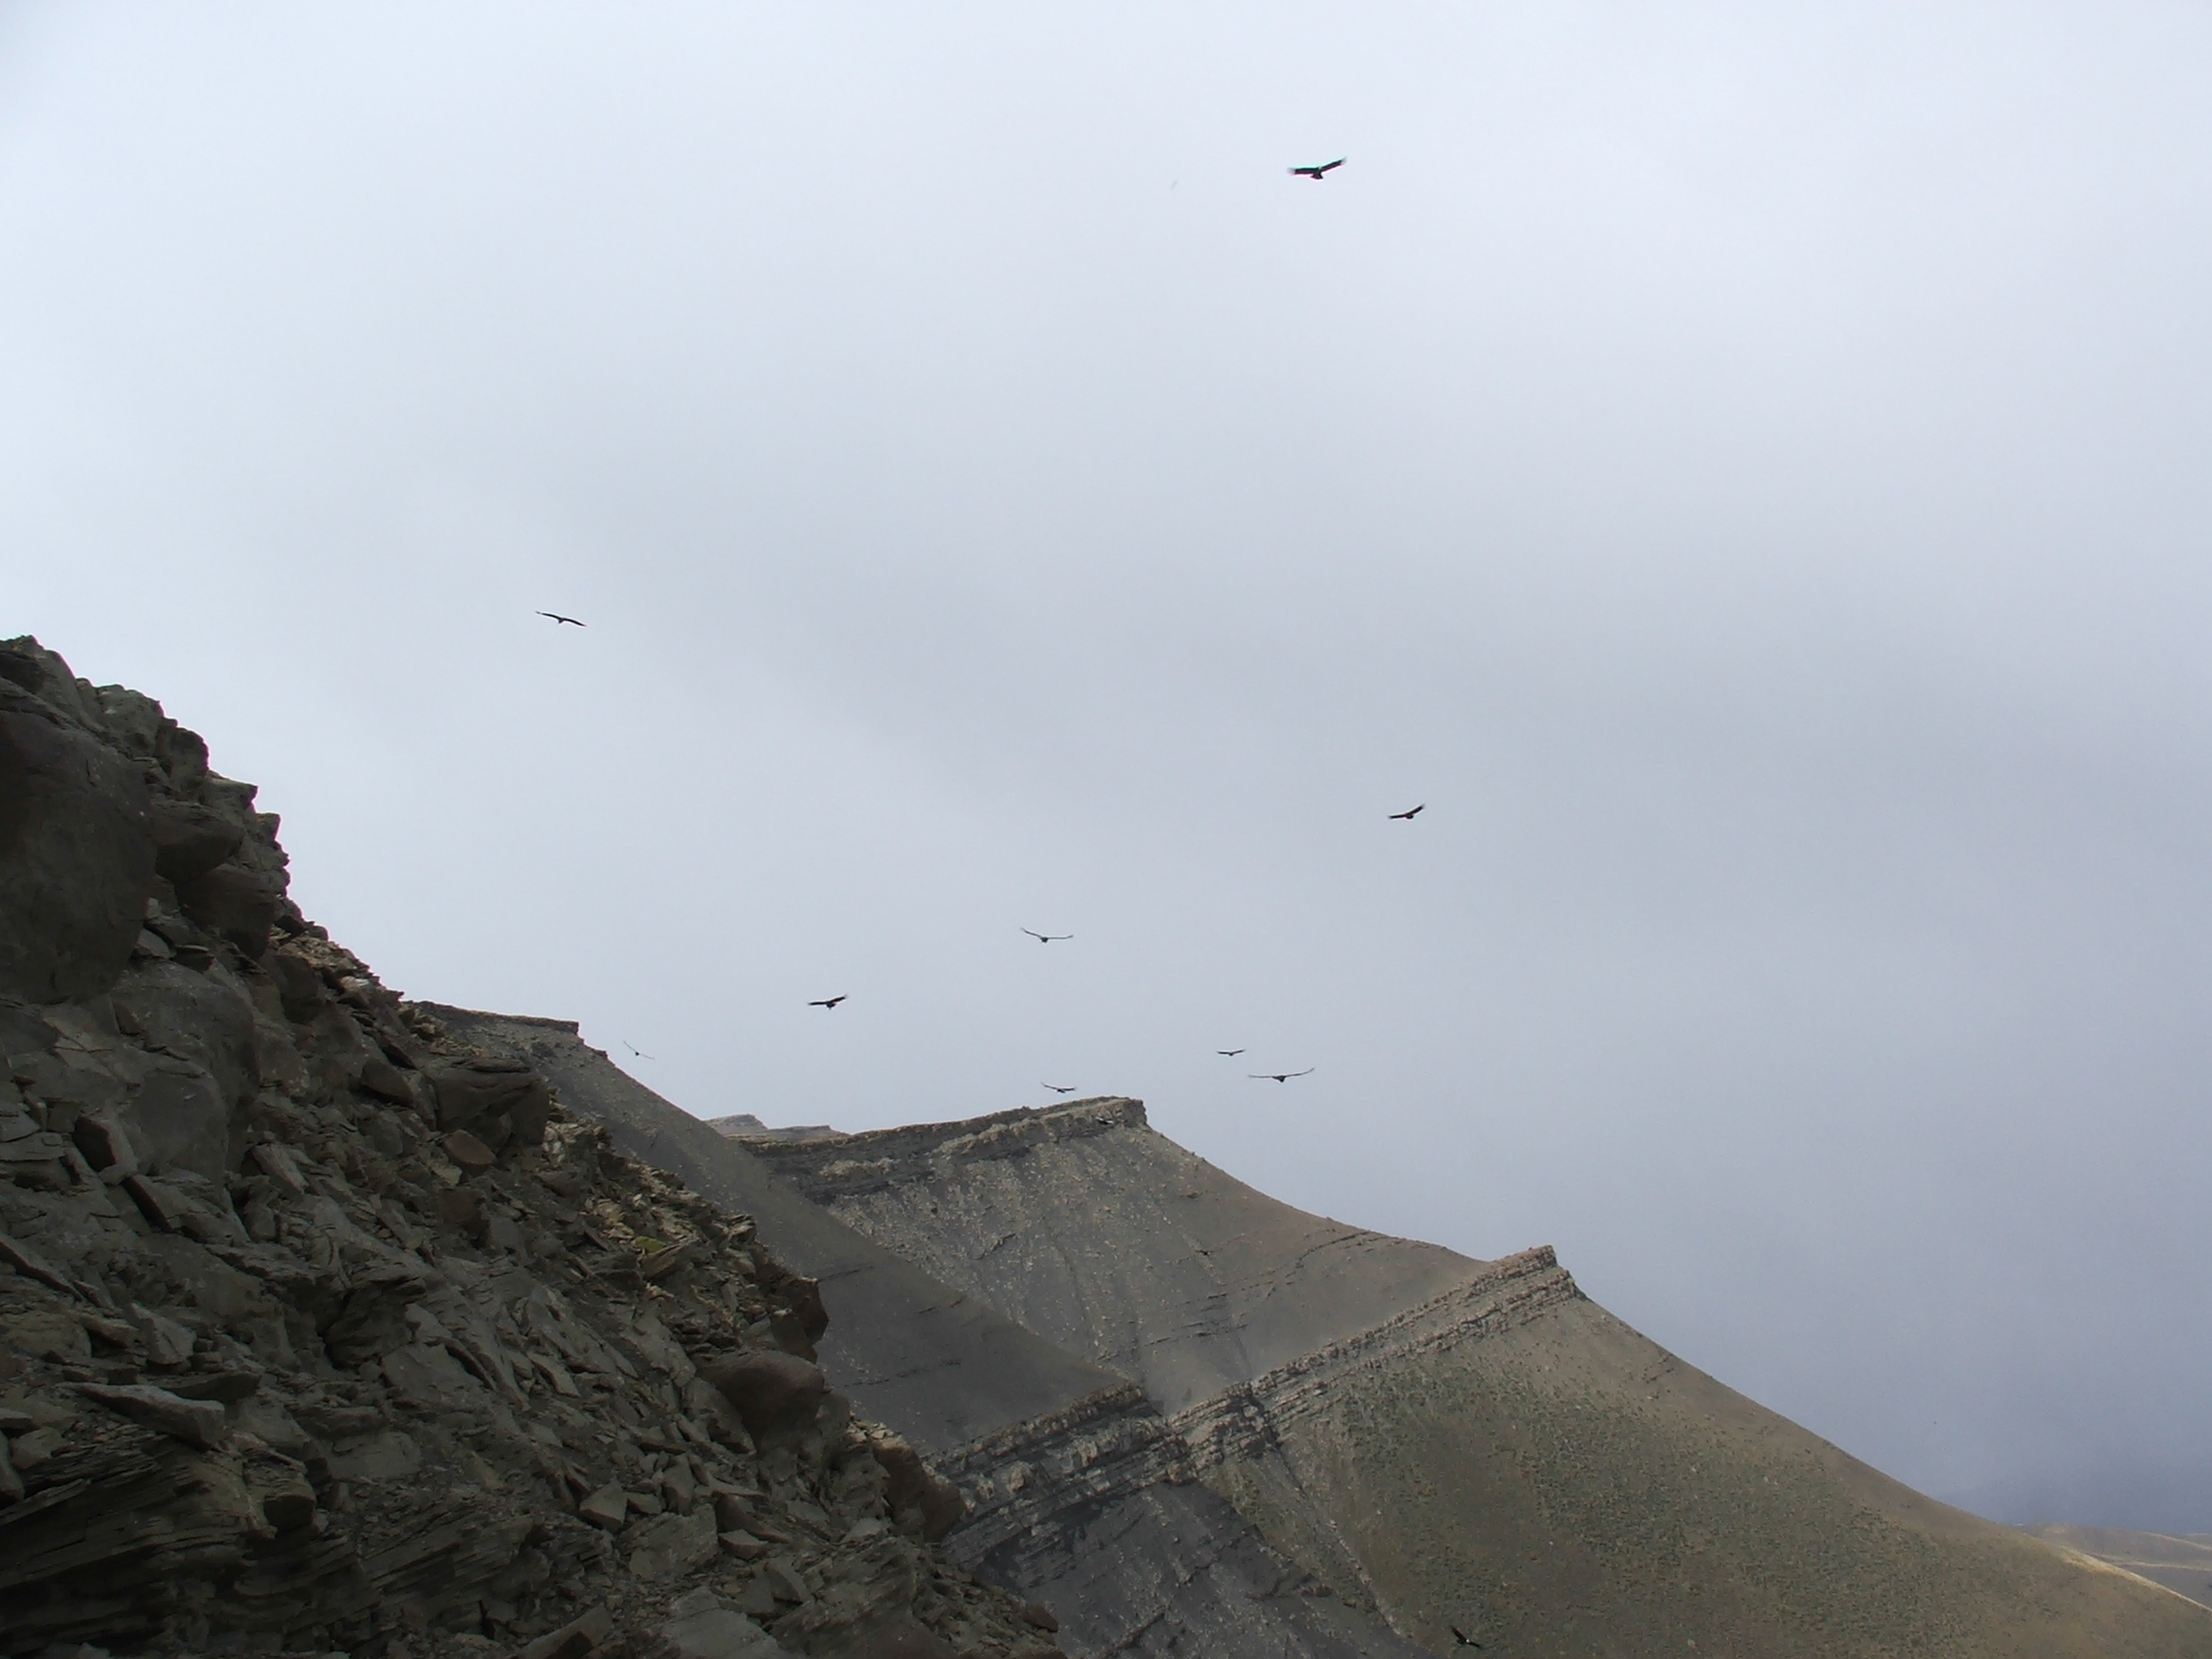
Even though they are scavengers, they will sometimes fly only a few meters above your head checking you out … it’s a bit disconcerting when your precariously perched on a cliff trying to collect some data.
Finally, the photo below is from earlier this year and is the best close-up I have of a Andean condor not flying. Note the nice white ‘collar’, very preppy … also, note the Cretaceous conglomerate on which it is perched.
Happy Friday!
–
See all Friday Field Fotos here.
See all posts tagged with ‘wildlife’ here.
~~~~~~~~~~~~~~~~~~~~~~~~~~~~~~~~~~~~~~~~~~~~~~~~~~~~~~~~~~~~~~~~~~~~~~~~~~~
Intellectual Welfare
Have you ever had one of those moments where you listen to someone talk about a concept or issue that you generally understand and agree with but come away with an even deeper understanding after listening to them?
I had one of those moments this morning. I listened to Kenneth Miller on NPR’s Science Friday podcast on the way to work and was blown away. I don’t know … maybe it was just the right combination of coffee and my state of mind, but I thought Miller very eloquently conveyed important aspects about the origination of the newest species in the evolving anti-evolution-movement genus (pun definitely intended!).
Many of you may be following this, and I’m sure numerous bloggers have already covered it … I’m having a difficult time just keeping up with the geoblogosphere, much less the science blogosphere at large these days. Kenneth Miller, who is a professor of biology at Brown University, has a new book out titled Only A Theory: Evolution and the Battle for America’s Soul. I haven’t read the book yet, but it covers the very latest in attempts to inject non-science into science class.
The anti-evolutionists are indeed changing and re-framing their rhetoric. Attempts to include ‘scientific creationism’ were generally struck down a couple decades ago (e.g., here). The movement was then rebranded as ‘intelligent design’ (ID), which took a beating in the 2005 Dover, Pennsylvania case.
The latest mutation is a bit similar to the ‘teach the controversy’ meme that was circulating a few years ago with IDers. But now we have the ‘strengths and weaknesses’ argument. Other phrases or words along these lines include ‘fairness’ or ‘academic freedom’ (e.g., Lousiana’s latest). Here’s the beginning of the proposed Lousiana Science Education Act (see pdf here):
…relative to curriculum and instruction; to provide relative to the teaching of scientific subjects in public elementary and secondary schools; to promote students’ critical thinking skills and open discussion of scientific theories; to provide relative to support and guidance for teachers; to provide relative to textbooks and instructional materials; to provide for rules and regulations; to provide for effectiveness; and to provide for related matters.
Sounds good, but guess what? There’s really only one scientific theory that proponents of the act really care about being critically analyzed – you guessed it! Evolution!
This is where Miller’s comments on Science Friday come in. I will paraphrase here, but I definitely recommend listening to the podcast.
Miller correctly reiterates that science is indeed about critically analyzing the data/information and accepting/refuting a specific idea based on that information. The strongest theories in science are those that have stood the test of time – through testing and evaluating of the concepts WITH DATA. Evolution has stood the test of time. Are the nuts and bolts of the mechanisms as we understand them today exactly as proposed by Darwin? No, they aren’t. In fact, his original ideas are based on observations of animals – it wasn’t until the discovery of DNA and the development of the discipline of genetics that we could really investigate the mechanism. We keep learning more and, yes, we are constantly revising and refining bits and pieces through critical analysis. That’s science.
Miller brings up the analogy of plate tectonics and how when he was a kid in the ’60s, the theory of plate tectonics was not generally taught in grade-school Earth science. At this point it was still being debated and discussed within the scientific community. As more data was analyzed and various ideas and sub-ideas were tested, plate tectonics, as a whole, “won the day” as Miller put it. Now, plate tectonics is standard in Earth science education – it provides the all-important context for the patterns and processes we see on our planet. Do we understand every last little detail of the mechanisms of plate tectonics? Certainly not – we are constantly debating about these details. Biological evolution is quite analogous (and has been around even longer).
The latest strategy of the anti-science crowd is to attempt to bring their ideas into a science classroom* in the name of fairness. This is a subtler, and potentially more effective, way to convince trick the general public to get on board^. Miller talks about science as a marketplace of ideas – a marketplace where competition (in the form of debate, discussion, publishing, etc.) reigns. Over the long term, the best ideas (i.e., the ones that can withstand testing/scrutiny) “win” in this competition.
The anti-evolutionists scientific ideas have lost time and time again. More fundamentally, their ideas are simply not scientific. They haven’t produced any data, there’s nothing to test, and they have no predictive value. Bringing their ideas into science class via legislation is, as Miller puts it, intellectual welfare. Their idea failed in the scientific marketplace and therefore needs propping up by government intervention. There may be some liberal progressives out there who don’t care for this particular application of the word ‘welfare’. Perhaps there is another way to put it, but I think it’s quite effective at communicating the issue.
In other words, the anti-evolutionists desire an intelligently-designed ‘science’, whereas most actual scientists envision a self-organizing system. The anti-evolutionists desire a centralized authority stipulating (via legislation) what science is and how science should be conducted. No thank you.
There’s a lot more covered in the interview and questions/comments from callers – definitely worth a listen. If anybody has already read or is reading Miller’s book, feel free to comment about it below.
–
–
* It is important to remember … this is all about curricula for science class. People can believe whatever they want in the comfort of their homes or at their place of worship; those beliefs simply do not belong in science class.
^ The most fervent global-warming deniers use similar rhetoric.
~~~~~~~~~~~~~~~~~~~~~~~~~~~~~~~~~~~~~~~~~~~~~~~~~~~~~~~~~~~~~~~~~~~
