Virtual Seismic Atlas

credit: Virtual Seismic Atlas (http://www.seismicatlas.org/)
Earlier this year I was informed about a fantastic new web resource for anyone interested in the geology of our planet beneath the surface (which should be everyone!). It’s called the Virtual Seismic Atlas (VSA):
The Virtual Seismic Atlas is an open access community resource to share the geological interpretation of seismic data. By browsing freely through the site you will find seismic images and interpretations. And you can down load higher resolution images for your use.
This is fantastic! Subsurface geologic data (especially in sedimentary basins) is intimately linked with the oil industry, which has resulted in a relative lack of information available to the public. If you start doing some digging there is a wealth of geophysical data out there that is available (e.g., see this USGS InfoBank page or this NOAA NGDC page). But you really need to be after something specific with databases like that … a certain geographic area or certain type of geophysical data. And you might need expensive software or specific technical knowledge to load/view those data. What the VSA does is provide a database of images showing examples of geologic features. I think it could be a fantastic resource for educators.
–
What exactly is seismic data?
To be more specific, it’s seismic-reflection data and it is currently our best tool for imaging the subsurface configuration of sedimentary basins (anywhere from 10s of m to 10 km depth). Sound waves travel down into the subsurface of the Earth and when they hit an interface between two rock/sediment types (and fluids play a role too) that have differing acoustic properties they reflect off that interface and travel back up to the surface where it is recorded. The result (after a lot of work processing the signal) is an image that more-or-less represents the subsurface architecture. There are some great web resources for learning more about the theory behind seismic data, its acquisition, and processing if you start searching around (e.g., here).
Even if you aren’t a hardcore geophysicist and don’t necessarily understand all the nuts-and-bolts of data acquisition and processing (e.g., me), you can still interpret the images.

credit: Virtual Seismic Atlas (http://www.seismicatlas.org/)
–
What kind of seismic images does VSA have?
The key to success of any online or virtual atlas is access to the information. I played around with the search capability using various keywords and the results were pretty good. Combined with the search function are these numerous categories and sub-categories:

These are essentially ‘tags’. You can see images by geography, data type, geologic age, and so on. For the ‘Depositional Architecture’ category I like how they use objective terms instead of other terms like “channel” that are thrown around willy-nilly and debated.

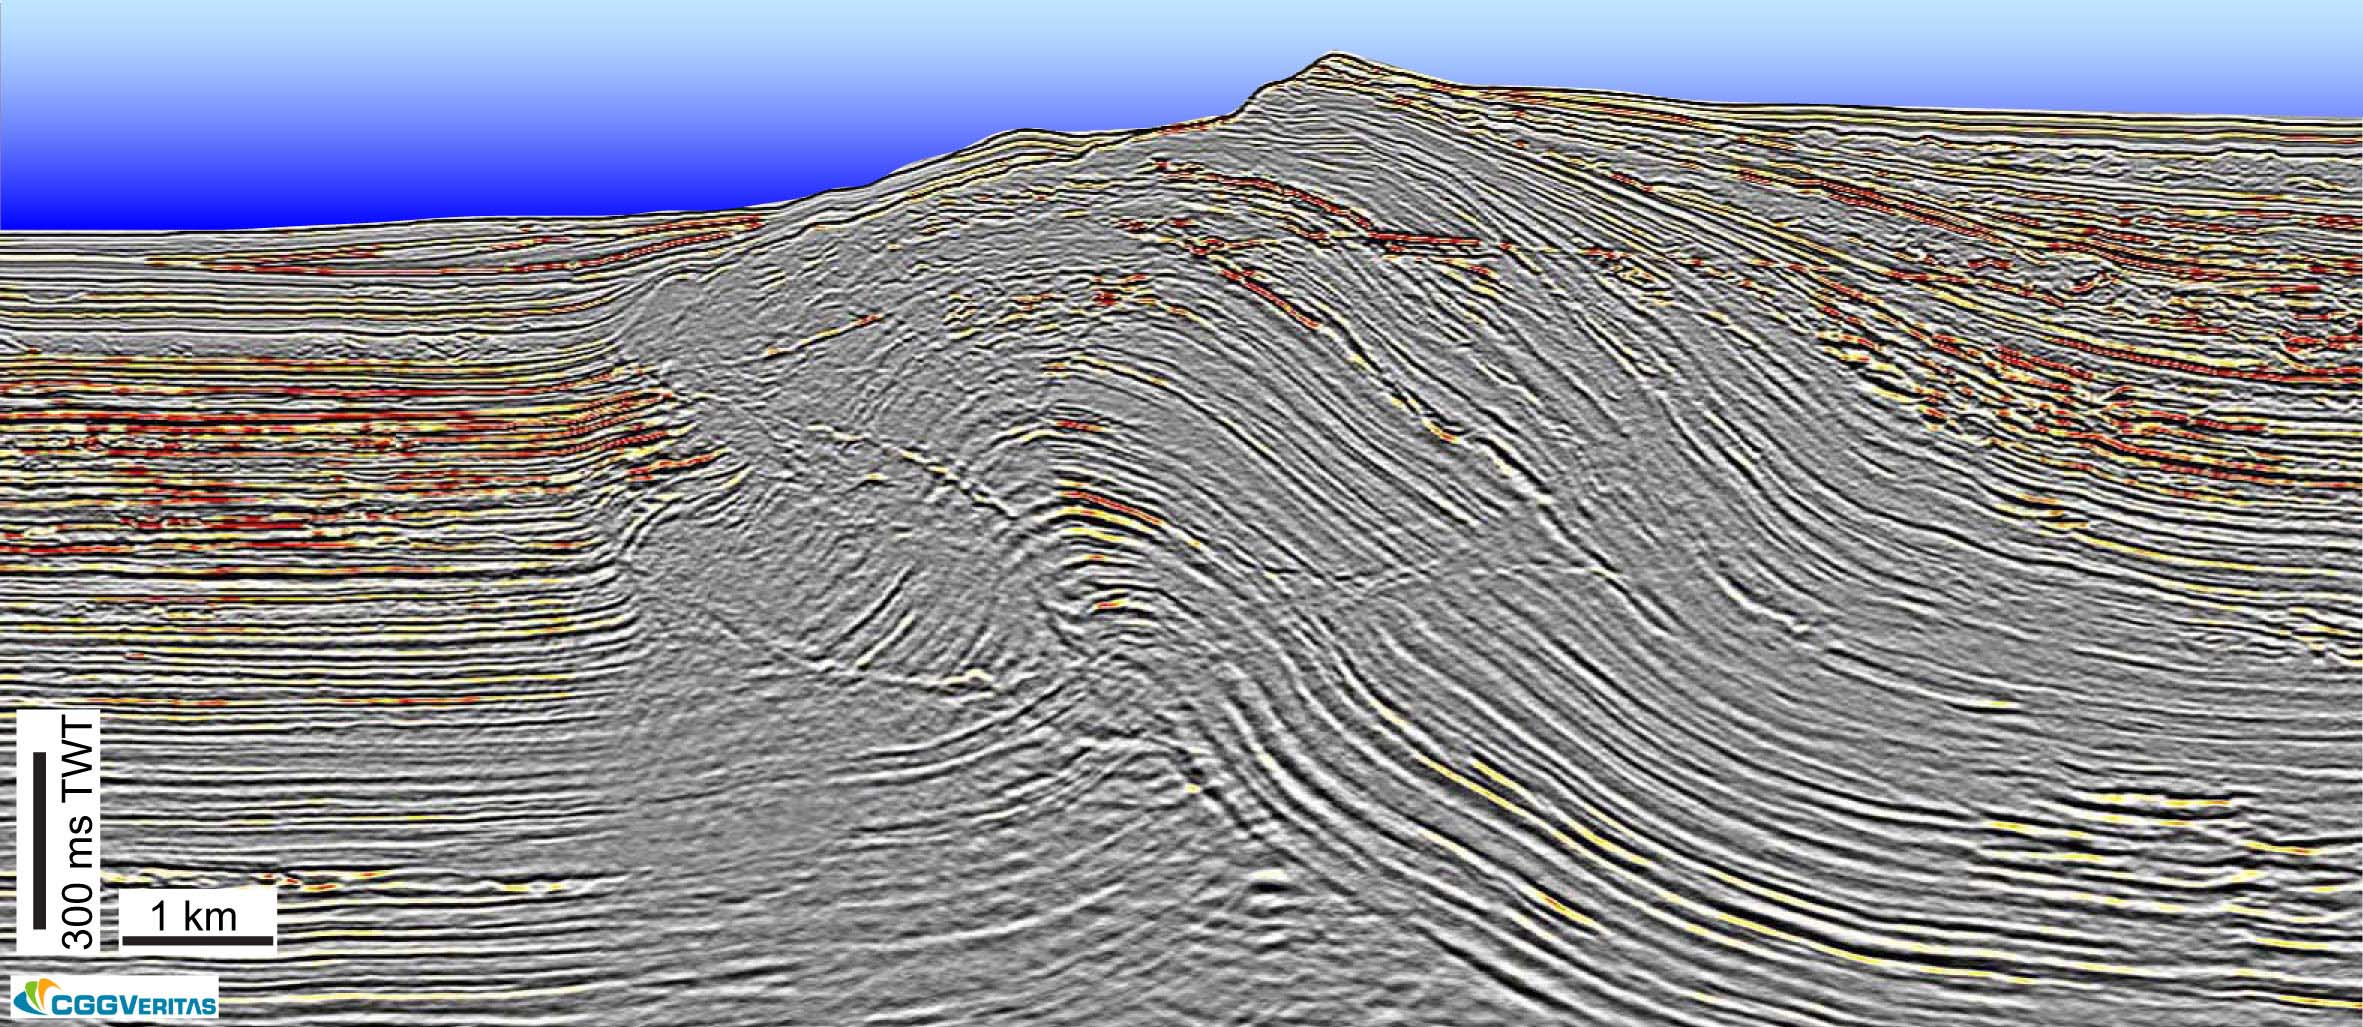
Calabrian accretionary prism, Ionian Sea -- credit: Virtual Seismic Atlas (http://www.seismicatlas.org)
The above image of the Calabrian accretionary wedge is one I came across just a few minutes ago while searching on the site (click on the image for a bigger version and then go here for more info from the VSA site). This particular image has some annotation on it, which is fantastic for teaching.
So, I recommend you go check out the Virtual Seismic Atlas and see what you can find. Have fun! I will definitely be using this resource for blog posts in the future.
–
Note: All images above are property of Virtual Seismic Atlas (VSA). They are available for personal or educational purposes, but please visit their site and read terms of use [pdf] before doing so.
~~~~~~~~~~~~~~~~~~~~~~~~~~~~~~~~~~~~~~~~~~~~~~~~~~
Trackbacks
- Sea-Floor Sunday #30: Submarine channels, deep-water Nigeria « Clastic Detritus
- Sea-Floor Sunday #42: Faulted sea floor, Ionian Sea « Clastic Detritus
- Deep-sea landscapes from the ice age « Hindered Settling
- Sea-Floor Sunday #42: Faulted sea floor, Ionian Sea - Tech News Archive
- Federal Records Show That Otto’s 18-wheelers Are Covering Fewer Miles Than Ever Before - Hot News In Tech

fantastic resource. thanks for the summary and links. I will pass on this information to some of my educator friends. Just curious, can you name the software needed to download the digital data from USGS and NOAA sites you mentioned?
cheers
Suvrat … it depends, I’d have to look again … for any files in .sgy format, there are many … Landmark’s SeisWorks is one off the top of my head.
Suvrat,
DELPH Seismic Interpretation software is also a perfect tool to process, visualize (2D/3D) and interprete seismic sections in SEGY format.
You may look at our new website – http://delph.ixsea.com – which also contains a seismic image library and readings on marine seismic data acquisiton, processing and interpretation.
Enjoy !
thanks for your information. I am a student in Indonesia