More submarine territoriality
My previous post dealt with Russia’s claim of that the Arctic’s Lomonosov Ridge belongs to them since it once was part of the Siberian continental shelf. It seems Argentina may have some issues about what part of the submarine landscape is theirs as well. Check out this short article from IPS (via geology.com). I don’t have the time right now to dig into this one in any detail, but here’s a blurb:
To draw up a definitive proposal for its maritime border, in 1997 Argentina created the National Commission of the Continental Platform Exterior Limit (COPLA), an inter-ministerial technical team that reportedly has already gathered 90 percent of the information necessary to demonstrate exactly where its territory covered by the ocean comes to an end.
Countries with ocean coasts have sovereign rights over the sea bed and subsoil to 200 nautical miles from land, which is known as the exclusive economic zone, or to where its continental platform ends, including the slope, up to a maximum of 350 miles. That includes the platform’s natural resources, but not the water that covers it.
The data obtained in laboratories and sea missions will have to be presented before May 2009 to the Commission on Continental Platform Boundaries, a technical body of the United Nations Convention on the Law of the Sea, which will decide whether to authorise the new border demarcation.
Unfortunately, this article does not show a map of the area in question (wouldn’t the citizens of this globe be so much more knowledgeable of geography if maps were always included?! …. but I digress).
Below is a map showing the topography and bathymetry of southern South America. The Argentine continental margin is a very different geologic situation than the one I discussed in the last post. This is a passive margin with a relatively wide continental shelf.
Argentina may have a better argument than Russia on this one. At least the shelf is still attached to the continent here.

If anyone, especially anyone reading this from South America, knows any more details about this, please don’t hesitate to post a comment.
Click on the image to go to the source.
~~~~~~~~~~~~~~~~~~~~~~~~~~~~~~~~~~~~~~~~~~~~~~~~~~~~~
Geology, geopolitics, and the Law of the Sea
 In the international game of territorial rights, geology matters.
Russia made news last week with their largely symbolic flag-planting on the Arctic sea floor at the north pole. The Arctic region is thought to host significant amounts of petroleum resources and, as the world’s demand for oil continues to grow combined with the disappearance of sea ice, nations wish to claim as much of this real estate as they can before exploration operations begin.
There is plenty of commentary out there on the blogs about this story specifically and the notion of Arctic oil exploration in general (e.g., here, here, and here) so I’m not going to focus on that. When I came across the short news article in this week’s Nature, I became more interested in what criteria are used to decide which nation gets what when it comes to the sea floor.
The Nature article is here, you’ll have to have a full license to see the whole thing, but I will quote a bit of it below.
The 1982 United Nations Convention on the Law of the Sea (UNCLOS) allows states an economic zone that extends 200 nautical miles from their coastline. To increase this, countries must prove to the United Nations Commission on the Limits of the Continental Shelf that their physical continental margin extends farther than this.

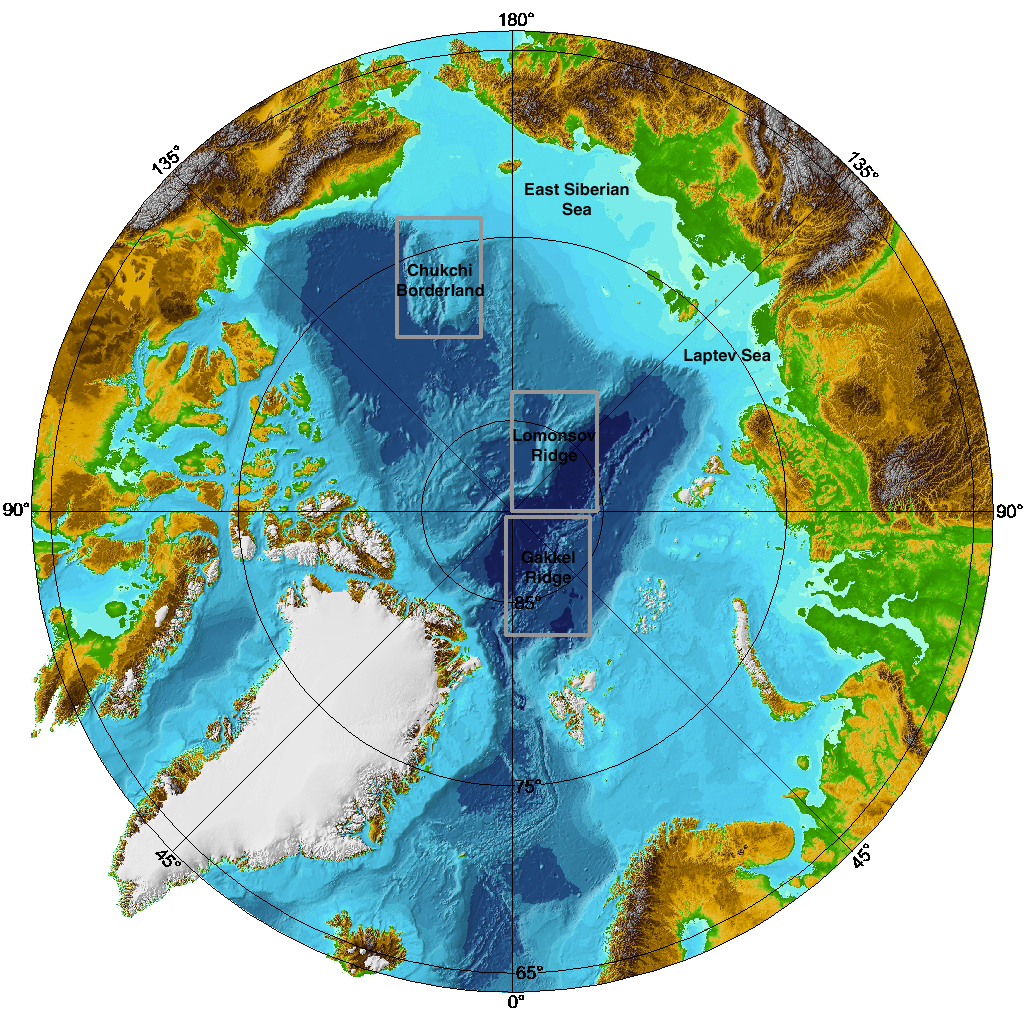
 The map from the Nature article (right) shows the 200 nautical mile line as a blue dotted line. Russia thinks they deserve more. They are claiming the Lomonosov Ridge is an extension of their continental shelf, which would significantly extend their sea floor territory.
If Moscow can prove that the structure of the continental shelf under the ocean is geologically similar to that of Russian land, it may be able to extend its territory. The Lomonosov Ridge, which it sees as a continental extension, is key to its claims. Russia hopes to claim 1.2 million square kilometres and, with it, the rights to copious mineral and fossil-fuel reserves.
Check out the full UN Convention on the Law of the Sea treaty here. If you go to the section on the continental shelf, you’ll find this statement as part of the definition:
The continental margin comprises the submerged prolongation of the land mass of the coastal State, and consists of the seabed and subsoil of the shelf, the slope and the rise. It does not include the deep ocean floor with its oceanic ridges or the subsoil thereof.
Emphasis mine. My first impression is that the Lomonosov Ridge, being an oceanic ridge and all, should therefore not be part of the definition of a states continental shelf territory. If a state disagrees with this determination, then they need to formally contest it with this UN entity, which they did, according to the Nature article:
In 2001, Russia became the first country to make a submission to the United Nations. It was told to supply more information, in particular about the Lomonosov Ridge, which runs under the Arctic Ocean between Russia and Canada. Russia claims this ridge is an extension of its Siberian shelf, but this is hotly contested by Canada and others.
What is the Lomonosov Ridge? I’m not an expert on Arctic geology, so I welcome any comments or links to better sources (especially resources in Russian). A quick search uncovered a 1992 Geology paper by Jokat et al.:
The 1500-km-long and 50-70-km-wide ridge rises 3 km above the adjacent abyssal plains and divides the Arctic Ocean into the Eurasian and Amerasian basins.The ridge is postulated to be a continental fragment severed from the margin during the early Cenozoic opening of the Eurasian basin.
The Jokat et al. paper makes some conclusions about the origins of the ridge based on multichannel seismic-reflection data they acquired:
The geometry and attitude of the deposits below the ridge unconformity strongly suggest the Lomonosov Ridge is the remnant of a prograding continental shelf facing the Makarov Basin.The progaded ridge flank facing the Makarov Basin indicates an early history of slope-rise sedimentation into the basin that existed before the Lomonosov Ridge separated from Eurasia.
On the map at the top of the post, the Makarov Basin is the region shaded in orange above where it says Lomonosov. Assuming these conclusions are correct, then Russia’s (and maybe Norway’s little section) paleo continental shelf did include what is now the oceanic ridge. But, of course, the determination is on the present configuration, right? Well, Russia is indeed claiming that since the ridge originated as part of the Siberian shelf, then it is still theirs.
Talk about opening a can of worms. Imagine if the UN allowed arguments of current territorial boundaries to be determined by where the territory was 10s of millions of years ago! That would get interesting.
How will all of this affect scientific research in the Arctic? I think it’s a double-edged sword in many ways. The prospects of opening the region to resource development will create major problems for researchers getting access to certain areas. On the flip side, a lot of mapping and imaging of the sea floor needs to be done to figure all of this out. The UN has said that their is “insufficient data” to resolve this. I’m certainly hesitant to be gung-ho about opening the relatively pristine Arctic region to petroleum operations, but, at the same time I get excited about the prospects of increasing our overall understanding of that region through sea-floor mapping, which is very expensive.
It will be interesting to see how this all shakes out.
 Get more information about the map above here.
Note: this post cross-posted on August 8th, 2007 edition of www.geology.com/news
Additional information on Lomonosov Ridge from Olelog here.
Cold War Goes North; Kommersant
Wikipedia’s page on the Lomonosov Ridge, which has a nice collection of links related to Russia’s territorial claim.
W. Jokat, G. Uenzelmann-Neben, Y. Kristoffersen, and T.M. Rasmuessen, 1992, Lomonosov Ridge; a double-sided continental margin: Geology, 20(10):887-890
~~~~~~~~~~~~~~~~~~~~~~~~~~~~~~~~~~~~~~~~~~~~~~~~~~~~~~~
Take the …Or Something poll
THIS POLL CLOSED AS OF AUGUST 20th, 2007
Blogger has added poll capability now, so I decided to give it a shot. Even though they say these polls are unscientific, what if the question is about science? Yeah….that’s right.
Anyway, my readership is not huge (yet) but is growing. My guess has always been its mostly my fellow geoblogospherons and a smattering of others that find themselves here. I’m curious to see what y’all are doing these days….so, take the poll (top of sidebar to the right).
Of course, the risk with these polls is that it effectively proclaims to the world just how lame your blog is because you have two votes on it for about a week. That’s why it’ll be open for several days.
I’ve accepted and even embraced my lameness a long time ago.
~~~~~~~~~~~~~~~~~~~~~~~~~~~~~~~~~~~~~~~~~~~~~~~~~~~~~
Video of experimental turbidity current
I post about turbidites a lot on this blog. I have never included a link to an online explanation of them because I am simply not satisfied with them. I should create a post of my own to do this but….well, that’s a lot of work and I don’t want to do it half-ass….you all know how it is.
Like many geoscientists, I find that visuals help immensely in understanding processes. We can go to a modern river, delta, tidal inlet, etc. and observe firsthand the processes. We cannot do this in the deep water; our monitoring of processes in this environment is extremely limited and still more-or-less indirect.
This is where lab experiments have value. But, turbidity currents that have been observed in historical times can be huge. The earthquake-triggered turbidity current that occurred offshore of eastern Canada in 1929 is estimated to have been 400 m tall, lasted for at least 12 hours, and traveled hundreds of km into the abyssal plain (note: I will post about that story another time…it is really cool). So, we have to scale them down. There are problems with assuming scale-independence when it comes to sedimentary processes, but, as a general exercise, we have learned a great deal from experiments.
This video below (via Paul Heller’s website) shows an experimental turbidity current in a tank. It is kind of long (>3 min)….you’ll get the idea after 30 seconds or so. Remember, this is subaqueous…notice the “head” of the current plowing its way through the water. The ambient fluid does not get incorporated into the current at the head, but rather is displaced over the top and mixes with the more dilute cloud. In this way, the turbidity current grows over time. The head also travels faster than parts of the flow behind it, which results in a lengthening of the current over time and distance. If you do watch the video to the end, you’ll get an appreciation of how real turbidity currents can last so long….it simply takes a long time for them to come to rest. The more volume, the longer the duration.
Stay tuned for more posts about the fundamental processes of turbidity currents and the deposits they create.
~~~~~~~~~~~~~~~~~~~~~~~~~~~~~~~~~~~~~~~~~~~~~~~~~~~~~~~~
High-resolution sea-floor image offshore San Diego
Just a quick post today to show you one of the latest multibeam bathymetric images released by the US Geological Survey. Go to this page to view and download the large-format PDFs.
If you’d like to know more about the technical details of the concept, design, and acquisition of multibeam sonar data, check out resources here and here.
 This one is definitely worth clicking on to see the high-res version. The densely populated onshore area to the right is San Diego, California. For a more regional context of southern California geologic provinces, check out this page. The San Andreas fault is 10s of km inland from this location, but subsidiary strike-slip faults dominate the tectonic fabric.
The major submarine canyon cutting into the narrow continental shelf is called La Jolla Canyon. The head of that canyon comes very close to the pier at Scripps Institute of Oceanography if any of you have been there. Note the transition from the deeply incised submarine canyon to a submarine channel system as you go into deeper water. Also note the meandering nature of the individual channel “threads” within the belt. This submarine channel eventually empties into the elongate San Diego Trough basin, which is off the image to the left and in even deeper water.
A paper that i’m a co-author on is coming out in Geology next month and deals with this canyon-channel system in more detail and its history over the last 40,000 years. I will post about that soon, so stay tuned.
The USGS page also has some great perspective views….here is the link again, check it out.
~~~~~~~~~~~~~~~~~~~~~~~~~~~~~~~~~~~~~~~~~~~~~~~~~~~~
Conglomeratic intrusions
A former fellow student (now professor), me, and our adviser have a paper out this month characterizing some very unique sedimentary features in Cretaceous strata of southern Chile: conglomeratic injectites.
Clastic intrusions, now termed injectites, have been recognized for a long time. In some cases, they resemble igneous intrusions (dikes, sills, etc.) with respect to their geometric relationship to the surrounding rock.
What are injectites?
They represent the violent remobilization of typically coarse sediment like sand due to over-pressurization. The best visual I can give you is imagine that you could press down on a jelly donut that was somehow sealed along the sides. That is, the jelly does not squeeze out of the side when you put pressure on it from above (overburden). Now imagine some plane of weakness in the fabric of the donut above the jelly layer. The overburden pressure will force the jelly into that plane of weakness and upward. If the movement of the jelly is of sufficient magnitude it will bust its way through the donut, creating its own path, and perhaps erupting at the surface of the donut.
Coarse sediment (usually sand) that is deposited in deep-marine settings is a mixture of sediment and water and it takes a while for the deposit to slowly de-water. If the sediment accumulation rate is high enough — that is, if these water-laden deposits get buried relatively quickly by more sediment this layer becomes the “jelly”. The increasing overburden pressure combined with some sort of trigger (seismicity? a threshold?) creates a situation for this large-scale injection to occur.
What’s cool about our study (at least we think its cool) is that we have (1) a great outcrop example of this phenomenon where the features are explicitly exposed and (2) the injected material is very coarse — cobble-sized material.
Now, we’ll be the first to admit that this paper is not high science. We literally came across these features and spent a few days mapping them out and characterizing them. There’s only so much time in a field season and we had other tasks to accomplish. So, this paper is very descriptive in that way…that is, we did not take it to the level of really figuring out how these things work. The mechanics of clastic injection is not well understood.
Because injectites are associated with thick piles of sediment they are being found by oil companies exploring for hydrocarbons in the subsurface. In fact, one hypothesized mechanism for contributing to over-pressurization is gas charging. Believe it or not, there is an entire book about the occurrence of clastic injectites and their relationship to petroleum systems. This paper is in that book. We were happy that the editors really wanted this stuff in there since we weren’t sure where else it would ever get published. Take it when you can get it!
Okay…enough set up….here we go.
 The figure above is the location information. I’ve said in the past that I would put together a post about the general geology of the area i’ve been working in Patagonia….I still mean to do that….someday. As always, click on the image to get a higher resolution view. The study area, Cerro Benitez, is in the center of the satellite image at right. These Cretaceous strata are part of the Magallanes foreland basin and now nicely exposed in the foothills of the southernmost Andes.
 The photos above show some of the close-up characteristics of these conglomeratic deposits. Notable are the near vertical groove-like features in F and G. By themselves, however, these small-scale features are not very telling.
 This next set of photographs (above) takes a step back and shows the conglomerate bodies in their full glory. The one shown in A and then enlarged in B is particularly nice (note circled person [me] for scale in each). When we first came across these features we thought the juxtaposition of the conglomerate against the shale had to be a fault contact. It’s not…we mapped the entire area. Then we thought these were some kind of channelized deposits, but the geometries were just not working out. When we spent a few days mapping out the multiple bodies and their relationship, an interesting picture emerged.
 The last day of characterizing the injection complex, we hiked to the other side of the lake and climbed up a mountain to take the photograph above. We felt we needed a view zoomed out even more….it took a day to get this photo….not the first time we spent a day to get a photograph down there. In the corresponding drawing below the photo, the yellow is the “regular” conglomerate bodies (referred to as stratified conglomerate) and the dark brown denotes the injected conglomerate. The cool part about this outcrop is that the old glacial lake created a flat terrace (shown in lighter gray) between two more vertical slices of the stratigraphy (shown in the dark gray). So, it’s sort of a “chair” display if you can visualize it. This little bit of three-dimensionality helped immensely in mapping out the different bodies.
 The schematic cartoon above (or, as the first author Steve likes to call it, the geophantasmogram) attempts to summarize the outcrop and how we’ve mapped it. Again, note the “chair” set up. The injectites emanate from the side of the channel-fill deposits, which is a pattern seen in injectites in the subsurface over and over again. Also, note the left complex on the diagram bifurcate and then head up through the strata until they terminate. The photos above with me for scale is the right branch of that bifurcating complex. The very ends of those injectite bodies lack conglomerate and are instead only sand reflecting a “fining-away” trend. That is, the “flow” of material had to come to a stop at some point, and the brief slowing down before stopping was enough to sort the material being carried.
 The last thing I want to touch on is the scale of this injectite complex compared to other known and well-studied examples from the subsurface. The figure above (which is the bottom half of the geophantasmogram) shows the cross-sectional outline of the injectite complex we characterized with some that have been mapped using seismic-reflection data in the North Sea. Firstly, notice the “winged” appearance of nearly all of these examples. Secondly, the bottom line is — our complex, as big as it seemed, is a tiny little sucker. For example, note the small rectangle on one of the little nubs in D. That rectangle represents the size of the complex we characterized. These North Sea injectite complexes really blow my mind.
Shadow of a moon and Kelvin-Helmholtz waves
 I saw this photo on Terra Que Gira a little earlier. Not only is it a striking photo…I just love that sharp, black circle against the more diffuse and swirly background of Jupiter’s atmosphere…but it also shows some nice Kelvin-Helmholtz waves, which are trains of waves typically marking a boundary or interface between two layers or regions of different turbulent behavior (commonly due to different densities). They happen in all kinds of fluids….sometimes you may even see them in clouds on Earth.
In a temporal sense, they commonly define the conspicuously organized transition from non-turbulent (laminar) flow to the much more random behavior of fully turbulent bursts and sweeps.
Check out this movie below of a simulation (click on it to go to movie, then go here for explanation)

Although they do occur in sedimentary features (bedforms), perfectly preserved examples of them are hard to come by.
Read more about the fluid mechanics of Kelvin-Helmholtz instabilities here, here, and here.
~~~~~~~~~~~~~~~~~~~~~~~~~~~~~~~~~~~~~~~~~~~~~~~~~~~~~
Theoretical Stratigraphy #1: Wheeler’s baselevel
 This post reviews some fundamental concepts of stratigraphy that are discussed in a 1964 GSA Bulletin paper by Harry Wheeler. At the same time, it is an essay about my own quest to really understand how time is recorded in rocks.

I was introduced to this paper and its ideas in an advanced stratigraphy class I took during my master’s program a few years back (which is the best class I’ve ever taken). Wheeler’s writing style is abstract and sometimes obtuse, but also very creative and profound. He has a handful of papers in the 1950s and 60s dealing with stratigraphic theory but I think the 1964 paper discussed here is the best summary of his ideas. This is one of those papers that you will need to read over and over again to “get it”. I learn something new every time. Historically, this is an important paper; a contemporary of Wheeler (and reviewer of the paper) was Larry Sloss, who published a famous paper in 1963 dealing with unconformity-bounded stratigraphic sequences in North America. Sloss was the mentor of Peter Vail, who is credited (along with his Exxon colleagues) with spearheading what is now referred to as seismic stratigraphy or sequence stratigraphy in the 1970s. I will deal with the Sloss-Vail view of stratigraphy another time.
First, to whet your appetite….let’s start with one of my favorite passages from Wheeler’s paper:
…the constantly varying undulations of the baselevel surface relative to the ever-changing lithosphere surface may be seen as a consistent function of the ebb and flow of depositional and erosional environments in the space-time continuum.
This single statement captures Wheeler’s view of how to approach unraveling the stratigraphic record. Laying out the concept of stratigraphic baselevel, which is fundamental to this view, is the thesis of this paper.
–
Review of the Baselevel Concept
John Wesley Powell first explicitly discussed base level in 1875 as the ultimate lower surface beneath which rocks cannot be eroded. He proposed this in his writings after exploring and mapping the landforms of the Colorado Plateau region. In this view, sea level is the “grand base level”. This idea is intuitive and is still an important concept in areas of geomorphology that deal with net erosion and denudation of the Earth’s surface. As Wheeler discusses in the opening paragraphs, Barrell (1917) is credited with extending the baselevel concept into the depositional realm. Here I quote Wheeler quoting Barrell:
“Thus the sediments [are] deposited with respect to a nearly horizontal controlling surface. This surface of control is baselevel [which is] of more inclusive content than the sense in which has generally been used by physiographers as a level of limiting the depth of fluvial erosion. Sedimentation as well as erosion is controlled by baselevel [which] is that surface toward which external forces strive, the surface at which neither erosion nor sedimentation takes place.” (Bracketed words are Wheeler’s.)
One of Wheeler’s contributions to the development of the baselevel concept is his challenge that it is actually a “controlling” force.
Although baselevel is indeed important, it exists as a surface only in the human mind; it controls nothing.
A statement like this could open a can of worms regarding how science in general deals with forces of nature and how best to discuss them, but let’s focus on Wheeler’s point. What he is saying is that viewing baselevel as a control is limiting. Regarding baselevel as a descriptor is much more inclusive and holistic, for lack of a better term. Wheeler argues that viewing the phase of degradation and aggradation of the Earth’s surface as having separate controls and also being split into separate scientific disciplines as misguided:
Many inadequacies of concept and practice stem from the popular notion that stratigraphy is the science of past sedimentation, to the exclusion of degradation; but if time is properly incorporated in the system, stratigraphers must concern themselves with the interpretation of degradational as well as aggradational patterns. Conversely, the geomorphologist who ignores depositional phenomena is equally delinquent.
In practice, of course, stratigraphy and geomorphology are intertwined, yet distinct disciplines. When dealing with parts of the Earth’s surface that are net depositional vs. net erosional different concepts and tools are utilized to characterize and understand them. But what Wheeler is getting at is much more fundamental.
The next major aspect of baselevel that Wheeler discusses is that it is not a horizontal surface. The figure below is straight from the paper (click on it to see a larger version and caption).

Wheeler argues that thinking of baselevel as a horizontal surface results in numerous baselevel surfaces that come and go in time. Moreover, either deposition or erosion could occur above or below these multiple surfaces at any one time, which further complicates the notion that there is a single, horizontal controlling surface. One argument is that the other, multiple surfaces are temporary and thus not the ultimate baselevel. Wheeler’s view of a baselevel surface, shown in lower half the figure, is that it is a non-horizontal surface that describes what the Earth’s surface, or the lithosphere surface as he calls it, is doing at that time. In other words, if degradation (erosion) is occuring, baselevel is “falling”; if the lithosphere surface is aggrading (deposition), then baselevel is “rising”. I will come back to this….for now, let’s move on.
–
Law of Lithosphere Relationships
Wheeler then discusses how the differement “movements” of the lithosphere surface relate to the passage of time. This is where his ideas get interesting.
But what of stratigraphic discontinuities as manifestations of nondeposition and accompanying erosion? Here we pass into the realm of no less important but completely abstract, area-time framework, in which a discontinuity takes on ‘area-time’ configuration in the form of the lacuna, which in turn, consists of hiatus and degradation vacuity.
Here, he is emphasizing the temporal value of nondeposition and erosion. It is intuitive to think about the passage of time when looking at a vertical column of stratigraphy. And the importance of significant unconformities goes back to the very foundation of the science of geology. Wheeler is proposing a more formal subdivision of this so-called “missing” time. Of course, there is no “missing” time….it is simply recorded as a surface and not as a deposit. The entire segment of time as surface, given the fantastic name of lacuna (an empty space; missing part), is subdivided into two parts:
- hiatus = time value of nondeposition and erosion
- degradation vacuity = time value of previous deposits that were removed by erosion
This is important. Wheeler points out that there are three separate domains of time (nondeposition, erosion, and what has been removed) all potentially recorded in a single surface!! He then, in old-school fashion, proposes a formal law of surface relationships as:
Time as a stratigraphic dimension has meaning only to the extent that any given moment in the Earth’s history may be conceived as precisely coinciding with a corresponding worldwide lithosphere surface and all simultaneous events either occurring theoron or directly related thereto.
Wheeler brings his view of baselevel (i.e., the non-horizontal, constantly undulating surface that describes the condition of aggradation or degradation) back in terms of an equilibrium relationship:
Baselevel thus intersects the lithosphere surface at all points of equilibrium, and its momentary ‘depth’ beneath or ‘height’ above the surface at any locality depends…on the relative ‘values’ of supply and energy.
The terms supply and energy are referring to the flux of sediment and the vigor with which it is transported. In other words, environments of high “energy” are those where erosion (i.e., degradation of lithosphere surface) is more likely. And, if you go back to the figure above, the points of equilibrium are where the dashed line crosses the Earth’s surface.
–
Baselevel Transit Cycle
In this section of the paper, Wheeler discusses the notion of stratigraphic cycles, a concept that has been pondered almost as long as geology has been a science, within the context of baselevel. A cycle of falling baselevel following by rising, or vice-versa, is thus termed a baselevel transit cycle:
If in an erosional environment at a given locality, the supply-energy ratio increases sufficiently to induce deposition, baselevel is forced upward across the lithosphere surface at that point at the moment deposition beings, thus initiating the first or depositional phase of a new cycle. This cyclic phase continues until the supply-energy ratio is decreased sufficiently to stop deposition and induce erosion, at which time baselevel makes its downward transit of the surface, thus beginning the second or hiatal cyclic phase.
This is getting into the realm of the stratigraphic sequence. As noted above, I will save the discussion of how Wheeler’s thinking and Sloss’s work have led to our current paradigms in stratigraphic theory. For now, I want to conclude this post with a discussion of Wheeler’s summary illustration of these ideas, which is one of my favorite figures of any geology paper.
–
Area-Time Configurations of Baselevel Transit
The first part of his Figure 2, shown below, is an idealized and hypothetical stratigraphic succession.

This example shows two sequences, A and B, that are separated by an unconformity at the left side of the diagram, and the same two sequences without a discontinuity, and thus one sequence at right (click on it for a larger view). Note the designation of time-equivalent surfaces, A1, A2, A3, etc., associated with each sequence.
The second part of this figure, shown below, takes this succession and puts it into area-time. In other words, the vertical axis is now time rather than depth/thickness. This kind of illustration of stratigraphy has become known as a Wheeler diagram.

If you’ve made it this far into this post….you should go all the way. It is worth it to look at the larger view of this figure (click on it) and study it in relation to the figure above. Remember, we are now looking at the succession in time:
Because geologists have not succeeded in developing the means for graphic portrayal of relationships in the space-time continuum, the area-time section is used.
The triangular domain that comes to a point from left to right represents the time recorded as surface, or the lacuna. As discussed above, note how the lacuna is subdivided into the hiatus and degradation vacuity. The “shape” of the lacuna changes across space … in this example its time value decreases from left to right as the unconformity transitions into a conformity. In other words, there is more “missing” time wrapped up in the unconformity at the left end of the succession. Now, when you compare this back to the corresponding area-thickness plot, you can see how this all fits together. Note how the A5 surface is truncated by the unconformity. And then when examined in the area-time plot you can see the A5 surface across the entire region, but a large portion of it is within the lacuna domain.
Wheeler notes that if we could generate accurate area-time plots such as this for any stratigraphic succession, the concept of baselevel might not be necessary. But, since we cannot, he states:
…even in time-stratigraphy it would unwise to avoid the role of baselevel, for the fact is most impressive that the constantly varying undulations of the baselevel surface relative to the ever-changing lithosphere surface may be seen as a consistent function of the ebb and flow of depositional and erosional environments in the space-time continuum.
This statement alone is why I think Wheeler’s ideas are so important to the science of stratigraphy. It is fundamental to our understanding of Earth history to view a stratigraphic succession as a continuous record. The emphasis on solely the accumulative part of the record misses much (probably most) of the history. Of course, characterizing a history that is so ambiguously represented (i.e., there is nothing there to characterize!) is difficult to impossible at any one location. The point of all this is to develop a theory about how time is recorded in rocks.
In future posts, I will try and put some of Wheeler’s concepts within the context of work that came before as well as after this paper.
–
NOTE: See Theoretical Stratigraphy #2 about a 1917 paper by J. Barrell that discusses rhythms of sedimentation and how these rhythms are manifested in the stratigraphic record.
~~~~~~~~~~~~~~~~~~~~~~~~~~~~~~~~~~~~~~~~~~~~~~~~~~
Friday Field Foto #24: Conglomerate injectites
 I don’t have a lot of time right now…still traveling…but wanted to get this Friday Field Foto posted while I wait for my flight (hopefully a better experience than the trip here). I’m not traveling at all for the next 5 weeks, so I should be blogging more frequently (and finishing my dissertation).
A paper I’m a co-author on just came out, which I will post about in more detail next week. The photo above (that’s me for scale) is a great view of some conglomerate injectites in Cretaceous sedimentary rocks down in Patagonia. I showed a photo of some smaller injectites previously on this blog.
Note the flat lying shale and thin-bedded sandstone that I am standing on juxstaposed against a more resistant conglomeratic body that is nearly vertical.
That must be a fault, right? Wrong. I know this may sound crazy, but this feature represents the upward injection of coarse-grained material through the overlying deposits. Yeah….right. Give me a few days and I’ll put together a better explanation of all this. It’s pretty wild stuff.
~~~~~~~~~~~~~~~~~~~~~~~~~~~~~~~~~~~~~~~~~~~~~~~~~~~
Airport blogging
 NOTE: This post has nothing to do with science…it is essentially a rant about unsatisfactory traveling circumstances.
Let’s see…it is now Friday night, about 9:20pm and we are sitting in JFK airport in New York City (i just took that photo at left). Yesterday (Thursday) morning, we left San Francisco at a little after noon, although we were supposed to leave at 9am. Delta Airlines says it was weather but I am skeptical. I think that their airline just sucks.
Let me back up for a moment…we are trying to make it to Buffalo, NY to visit some family and friends of mine (this is where I grew up). Why would you fly all the way to New York City and then backwards back to the west to Buffalo you may ask. Because Buffalo is one of those crappy little cities that you can’t get to direct from anywhere outside a 800 mile radius. We flew right over the damn place on the way to New York.
So…we landed at JFK last night too late to make our original flight to Buffalo. The last flight, which we were on standby, was then mysteriously canceled. We weren’t the only ones screwed…pretty much everyone who was trying to make a connection at JFK got hosed as well. Then we had to stand in a very long line of very unhappy people to find out when we would actually leave. And apparently airlines no longer get you a hotel room…sweet…we have to find a place to stay.
But wait…there’s more! Now we head down to baggage claim to get our bags that never got put on the flight to Buffalo (since it never happened). They don’t know where they are. Excellent. They find them after about an hour and half…I think if they would’ve simply let me behind those doors saying AUTHORIZED PERSONNEL ONLY I could have found them in 5 minutes! Miraculously, our and many others bags are found. People erupted with screams of joy and excitement.
Then we try and find a motel…we ended up about 30 minutes to the east on Long Island. I’m pretty certain that this motel service at JFK is in cahoots with the taxi companies so they can drive people like us who don’t know anything wherever they want. Our cabbie even pretended to not know where the place was…yeah, right.
On a positive note, we ended up hanging out with some good friends who live in Brooklyn all day today. It was a beautiful day and we had a nice big lunch with some beers at a streetside cafe. So, it wasn’t all bad. As an aside, we tried calling these same friends last night to crash, but alas it was too late and they had gone to bed.
So…now we are sitting waiting for our flight…that was supposed to be leaving right about now. It is now theoretically scheduled to depart at 10:30pm. I am tracking our plane which is coming in from Virginia or something…it is in the air. We are being positive that it might happen tonight.
If not, we know some other people in NYC and have already alerted them that we may be calling them to hang out tonight and who knows how long after that.
The key to getting through something like this is to be with a travel partner. When one of you sinks to a low of frustration…the kind of state where you feel like fire-bombing the place…that the other person stay relatively upbeat and productive. As long as the two of you stay out of phase everything will be fine. If the both of you sink to a low together, you’re done for.
Good times.
p.s. Delta Airlines sucks
~~~~~~~~~~~~~~~~~~~~~~~~~~~~~~~~~~~~~~~~~~~~~~~~~~~~~~~~
