Subduction Denialism, Part 2: Subduction zones, trenches, and accretionary complexes
This blog has moved to Wired Science (as of Sept 14, 2010)
URL: http://www.wired.com/wiredscience/clasticdetritus/
RSS: http://www.wired.com/wiredscience/category/clastic-detritus/feed
–
Note: This is the second post in a three-part series — Part 1 from earlier today is required reading. Without it you will have no context for most of this post. After reading this, go to Part 3.
–
Alrighty … so the overall objective here is to discuss the Cascadia subduction zone and why it does not have a distinct and discernible trench like other subduction zones do. My claim to Anaconda was that (1) there has been a significant amount of sedimentation across this margin, and (2) the Cascadia margin has a robust accretionary wedge — you can see my original comment as I stated it here. These two aspects have a lot to do with the physiography of this plate boundary as we see it today.
But before I focus on Cascadia, I wanted to show some data from various modern subduction zones. I show a lot of data below without too much interpretation or synthesis. This is on purpose. For those that are skeptical of or claim subduction is a “myth”, you are welcome to interpret these data differently.
IMPORTANT: This post is not a comprehensive review of subduction, this post is not ‘one-stop shopping’ for everything you’ve ever wanted to know about subduction — what I show below is the tip of the iceberg. I list more references at the bottom of the post and at the bottom of Part 3. I strongly encourage you to familiarize yourself with the literature.
–
Maps and Profiles of Convergent Plate Boundaries
Let’s take a quick look at several of Earth’s subduction zones — to get a sense of which ones have distinct trenches and which ones do not. The following series of maps and topographic profiles were created in GeoMapApp, which is a FREE web tool for exploring Earth’s bathymetry/topography. Again … this is free … it’s not behind subscription, it’s not only for those with a university/corporate license, it’s available to the public to use for research and education. Did I mention that this tool is free?
All maps are more-or-less at the same scale.
First, the focus area for this series of posts — the Cascadia plate boundary region of the northwest United States and southwest Canada. In fact, there are three plates in this view — Pacific, Juan de Fuca, and North American.
Below is a topographic profile across the margin (its position marked by the white horizontal line in the map above).
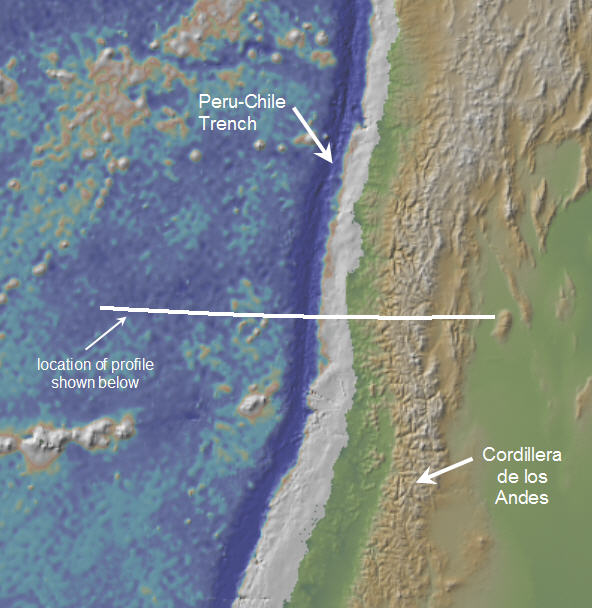
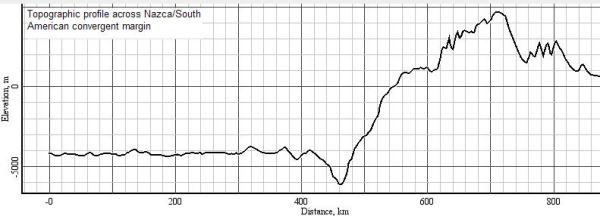
Next is a plate boundary that does have a significant trench — the Peru-Chile trench of the Nazca/South American margin.
The trench is clearly visible in both the bathymetry (darkest blue color) and in the profile below.
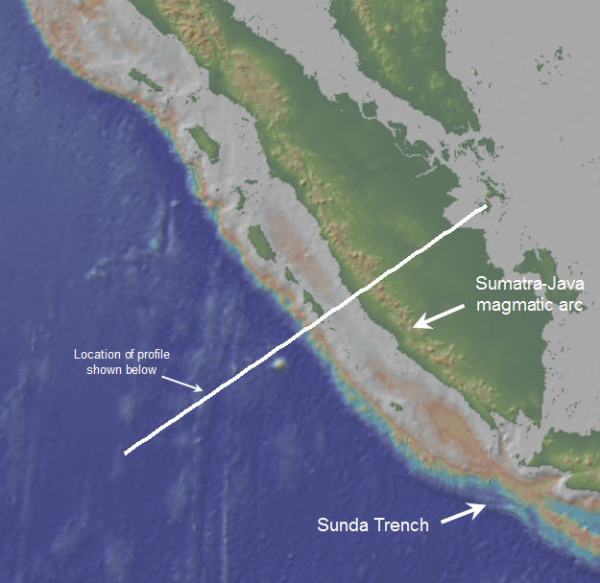
The Sumatran subduction zone got a lot of mainstream press back in 2004 because of the devastating tsunami. As a result, there are some web resources available to the public to learn more about this area (e.g., USGS summary poster on the earthquake).
The Sunda Trench is not as distinct as the Peru-Chile trench but is still discernible. It becomes a much more recognizable trench in the southeast corner of the map and then off the map to the east.
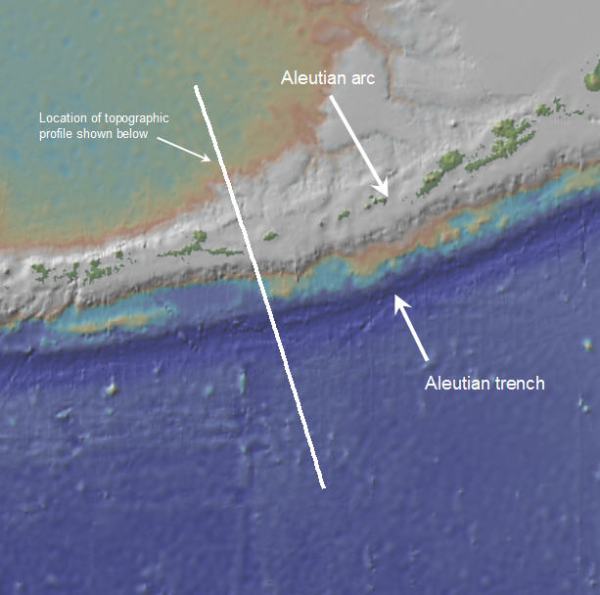
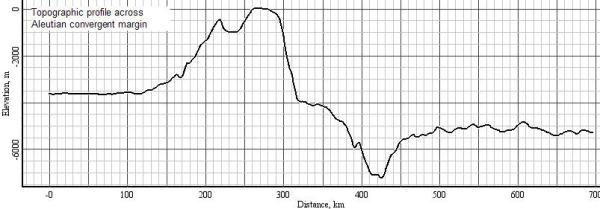
The Aleutian system has a pretty decent trench.
Note that depending on where you put the profile generator (it’s fun, you should try it) the arc barely pops out above sea level.
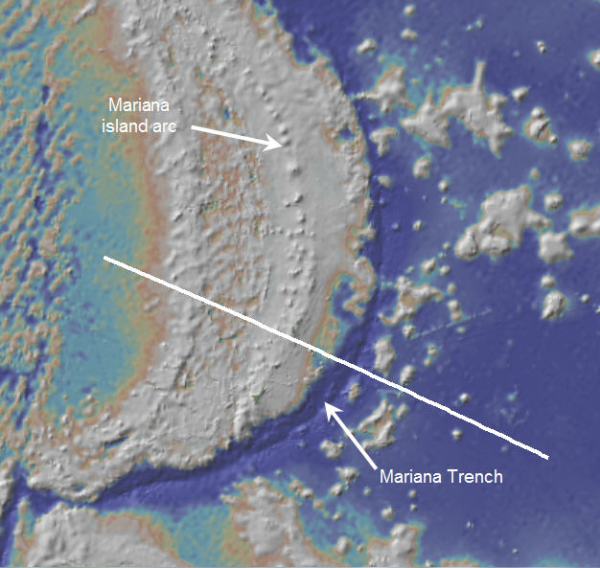
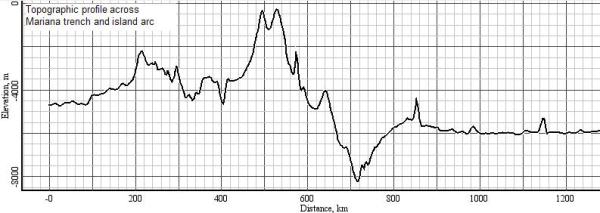
Here’s the Mariana system. It’s important to note that this is a full-fledged island arc system (two oceanic plates) whereas the Cascadia and Nazca-South American are continental arcs (one oceanic plate, one continental plate). The Sumatran and Aleutian systems are a bit different as their backarc regions are flooded shelfal areas (e.g., see Aleutian profile just above).
As you probably know, Mariana trench is the deepest/lowest place on the surface of the Earth (at nearly 11 km below sea level).
Finally, the last one in this series of maps and profiles is the Nankai Trough region offshore southeastern Japan.
The Nankai Trough is perhaps not as distinct as either the Chile trench and certainly not the Mariana, but is still noticeable in the profile below.
These maps and profiles were presented to show the spectrum of physiographic styles of subduction zones.
Next, I will show a few examples of data from beneath the surface. I’ll start with relatively new data acquired for the Nankai Trough region.
–
Geophysical Imaging of Subduction Zones
Observing the structure and configuration of the Earth’s crust requires geophysical imaging techniques. Reviewing geophysical theory and the various types of data acquisition and processing methods is way beyond the scope of this post. There are numerous textbooks written on the subject and I found a few good websites as well with some simple googling (e.g., here, here, here, and here).
To my knowledge, the highest-resolution subduction zone imaged to date is the last map/profile I showed above, the Nankai Trough. This is largely a result of this area being the focus area for a research project called the Nankai Trough Seismogenic Zone Experiment (or NanTroSEIZE). This program is in progress — they’ve already done a lot of seismic acquisition and some drilling into the accretionary wedge. I’ve posted about this a year ago (here) but will show the images again right now.
The first image is an absolutely gorgeous bathymetric map of the trough and accretionary complex region. The “frontal thrust” area marks the boundary between the trough and the ‘crumpled up’ (i.e., folded and faulted) accretionary wedge.
This map pattern suggests a compressional structural regime. How can we test that? What does this area look like in cross section?
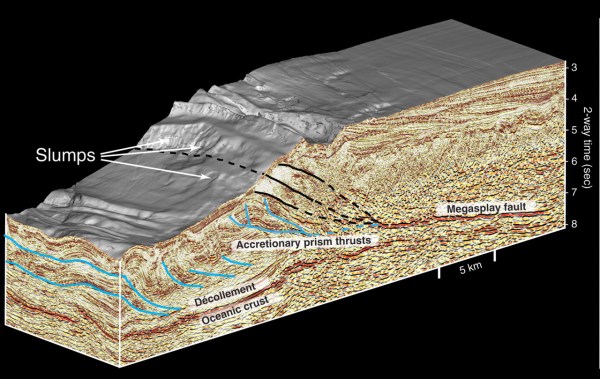
Fig. 8: Block diagram of 3D seismic-reflection survey of accretionary wedge offshore Japan's southeastern margin (from Moore et al., 2007)
The perspective block image above is from the 3D seismic-reflection survey. Click on it for a full resolution version. The seismic reflectors clearly show the reverse and thrust faults within the accretionary complex as well as the top of the oceanic crust underneath it. A model of converging plates explains these compressional features. A model of an Earth where there is no convergence must account for these observations (both conceptually and specifically right here on this spot on the Earth). To put it bluntly, how did the Nankai accretionary complex form without convergence?
The Moore et al. (2007) paper goes into much more detail, but if you don’t have access you can find much of these data in the IODP Expedition 314 Preliminary Report, which summarizes one of the drilling legs. In the introduction of this report, there is the following:
The Nankai Trough is a subducting plate boundary, where the Philippine Sea plate underthrusts the southwestern Japan margin at a rate of ~4.1–6.5 cm/y along an azimuth of 300°–315°N (Seno et al., 1993; Miyazaki and Heki, 2001) down an interface dipping 3°–7° (Kodaira et al., 2000).
The Nankai subduction zone forms an “end-member” sediment-dominated accretionary prism. In the toe region off Muroto, a sedimentary section ~1 km thick is accreted to or underthrust below the margin (Moore et al., 2001).
I’ve put the full citations for these references at the bottom of the post for those interested in the details about plate movement rates and azimuth measurements. As you’ll see later in Part 2, the Cascadia subduction zone shares this sediment-dominated characteristic.
The figures below are in the same general area but at a much different scale — instead of several kilometers deep into the subsurface, these seismic wave velocity profiles reveal structure 10s to 100s of km into the subsurface.

Fig. 9: Mantle wedge tomography across Honshu, Japan, after Zhao et al. (1992). Earthquake loci are projected as small open circles, relative mantle P-wave velocities are shown in colors, from red (slow) to blue (fast); (http://www.nsf-margins.org/SEIZE/Nankaifigs.html)
Although the authors of these figures, which can be found on the NSF-MARGINS site here, denote their interpretation of the subducting Pacific Plate with the black lines, one can clearly see the distinct west-dipping ‘fast’ (blue color) velocity structure. In addition, the dots show the location of earthquakes. This dipping planar zone of earthquakes that have been documented in association with plate margins interpreted as subduction zones is called the Benioff zone (or Wadati-Benioff zone).
The general relationship of earthquakes to plate boundaries is well established. The figure below (from this seismology textbook) shows global seismicity for all depths in the top figure and just the deep earthquakes in the bottom figure.
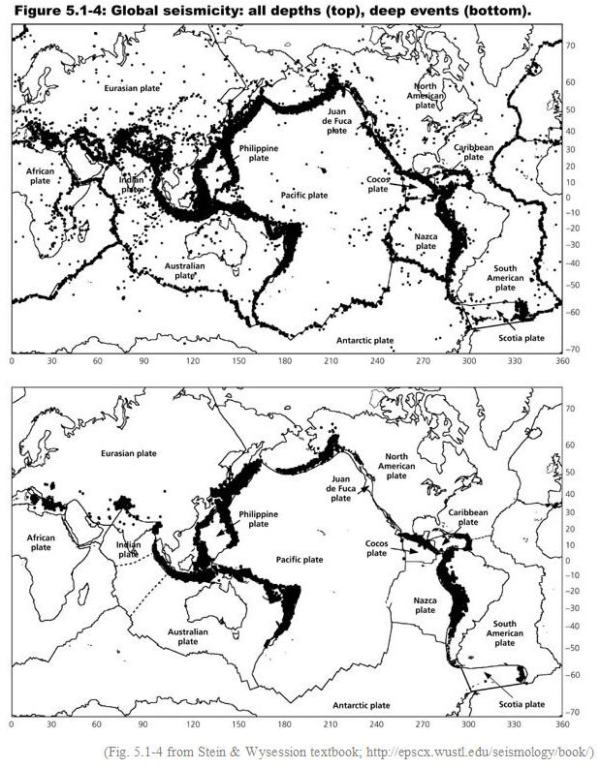
Fig. 10: Global seismicity (a) all events, (b) deep events (credit: Stein & Wysession; http://epscx.wustl.edu/seismology/book/)
These deeper earthquakes are those associated with that dipping Benioff zone as seen above in Fig. 9. These are the measurements, the observations — a model of the Earth where there is no convergence (only divergent boundaries) must account for these observations if the hypothesis is to be further tested.
–
The image below is the P-wave velocity structure of a transect of the Izu-Bonin-Mariana (or IBM) arc system. This image and much more can be found on the NSF-MARGINS ‘Subduction Factory’ initiative’s webpage for the IBM system.
I’m not going to try and explain all the details of seismic velocity studies here — firstly, the details of it are beyond my expertise and, secondly, that’s not really the point. The P-wave velocity structure data shown above is what it is. Interpret it.
–
The next image (below) is from the Indonesia-Tonga region (north of Australia) and shows anomalous P-wave velocity structure over a 30 degree transect going down 1500 km (east to the right).
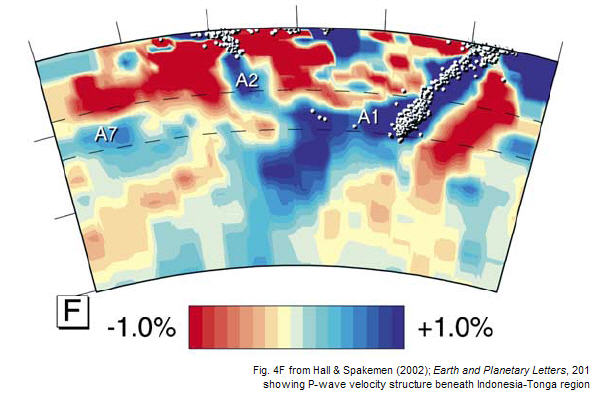
Fig. 12: P-wave velocity structure under the Indonesia-Tonga region along 30 deg segments to a depth of 1500 km (from Hall & Spakeman, 2002; Earth and Planetary Letters, 201)
The white dots in the distinct inclined blue band represent earthquake hypocenters. Again … this is just another example of data. You’ll have to read the paper for more details about their methods and how they interpret these data.
–
Okay … one more — the image below is beneath Costa Rica and again displays seismic wave velocity structure.
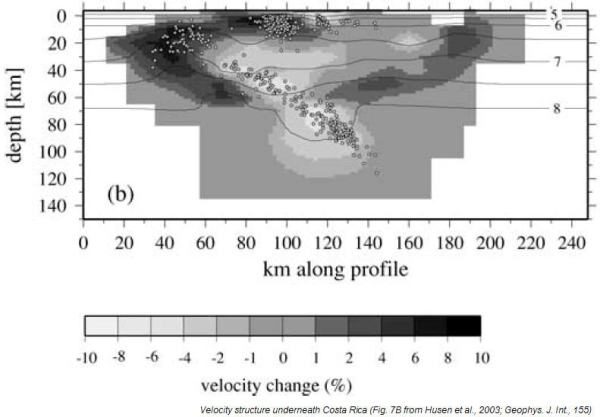
Fig. 13: Velocity structure underneath Costa Rica - dots represent earthquake hypocenters (from Husen et al., 2003)
Based on these (and more) data, the authors of this paper conclude:
Both the 3-D P-wave velocity structure and petrological modeling indicate existence of low-velocity hydrous oceanic crust in the subducting Cocos Plate beneath central Costa Rica. Intermediate-depth seismicity correlates well with the predicted locations of hydrous metamorphic rocks, suggesting that dehydration plays a key role in generating intermediate-depth earthquakes beneath Costa Rica.
That statement brings up composition — an additional aspect that I’m not going to address in these posts. I’m also not going to talk about arc magmatism, high-pressure/low-temperature metamorphism, and so on. Perhaps other geobloggers can chime in about those topics. But I would point out that, any conceptual model of how the Earth works must integrate ALL the information available.
At the risk of sounding like a broken record … if you disagree with the interpretations in the studies above, please study the papers in detail and evaluate the methods and conclusions. Seismology and tomography are highly technical and quantitative fields of study that take years of training and experience. If necessary, engage the authors for any clarification of acquisition, processing, or other computation related to the data presented. The vast majority of researchers respond well to sincere (and polite) inquiries about their own research. If you think their methods and data are in order, then reinterpret and present a mechanism for the observed patterns.
In addition to seismologic-based investigation of the Earth’s interior, geophysicists also use gravity and magnetics. Addressing the wealth of geophysical data from around the planet from the thousands of researchers over several decades is beyond the scope of this measly little blog post. I encourage everyone to familiarize themselves with the concepts and the data that support these concepts.
–
Accretionary Wedges
Before moving on to Part 3, which deals with the Cascadia plate margin in a bit more detail, I’ll conclude this post with some general words about accretionary wedges.
Accretionary wedges (also known as accretionary complexes or accretionary prisms) are essentially compressional fold-thrust belts composed primarily of oceanic sediment and, in many cases, continentally-derived sediment from the nearby continental plate. The faults and folds, in general, verge towards the oceanic plate (i.e., look at the black and blue lines that show the faults on Fig. 8 above). Anticlinal structures that include some landward-verging reverse faults (referred to as antithetic) are produced, with create the tectonic ridges that you can see in the bathymetric map in Figs. 7 and 8 above. Deformation and sedimentation occur concurrently and incrementally throughout the evolution of the system. There are numerous studies that examine accretionary wedges from around the world and compare and contrast their structural styles (e.g., Scholl et al., 1980 and Moore, 1989 are just two).
If you are somewhat new to the study of the relationships of tectonics and sedimentation I enthusiastically recommend the 1995 textbook ‘Tectonics of Sedimentary Basins’ edited by Busby & Ingersoll (which is apparently now out of print, but used copies can be found). The chapter on trenches and trench-slope basins (by Underwood & Moore) is a fantastic synthesis and great starting point for learning more. Regarding accretionary-style subduction zones, they state:
In accretionary subduction zones, trench-floor and oceanic-plate deposits are added to the toe of the landward trench slope (or inner slope) by imbricate thrusting. A detachment surface, or décollement, separates the upper part of the accreted section (i.e., zone of offscraping) from material that is underthrust beyond the base of the slope. Above the décollement, offscraped sediment is transferred to the accretionary prism (or accretionary wedge), and this prism displays a rugged and irregular seafloor morphology governed by numerous tectonic ridges that form by folding and fault dislocation.
Take one more look at Figures 7 and 8 above of the Nankai accretionary wedge to get a sense of these general patterns.
The figure below is a sketch that illustrates accretionary wedges quite nicely. This is a line drawing of seismic-reflection data that you can find on this site.
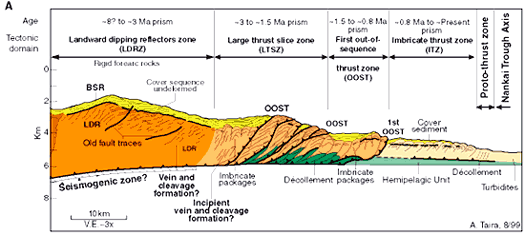
Fig. 14: Line drawing of seismic-reflection data showing features of the Nankai accretionary wedge (http://www.netl.doe.gov/technologies/oil-gas/FutureSupply/MethaneHydrates/about-hydrates/nankai-trough.htm)
It’s important to note that although accretionary wedges from around the planet share certain general characteristics, each one has unique and idiosyncratic features as well.
Part 3 investigates the Cascadia plate boundary region with special emphasis on the sedimentation history and accretionary wedge.
–
References Cited (note: this is the list for the specific papers referred to above, see this longer list for more about subduction in general):
Busby and Ingersoll, 1995, Tectonics of Sedimentary Basins, Blackwell.
Kinoshita, M., et al., 2008, IODP Expedition 314 Preliminary Report, NanTroSEIZE Stage 1A; doi:10.2204/iodp.pr.314.2008
Kodaira, S., Takahashi, N., Park, J., Mochizuki, K., Shinohara, M., and Kimura, S., 2000. West-ern Nankai Trough seismogenic zone: results from a wide-angle ocean bottom seismic survey. J. Geophys. Res., 105:5887–5905.
Miyazaki, S., and Heki, K., 2001. Crustal velocity field of southwest Japan: subduction and arc-arc collision. J. Geophys. Res., 106(B3):4305–4326. doi:10.1029/2000JB900312
Moore et al., 2007, Three-dimensional splay fault geometry and implications for tsunami generation: Science, v. 318, p. 1128-1131. DOI: 10.1126/science.1147195
Moore, G.F., et al., 2001. New insights into deformation and fluid flow processes in the Nankai Trough accretionary prism: results of Ocean Drilling Program Leg 190. Geochem., Geophys., Geosyst., 2(10). doi:10.1029/2001GC000166
Moore, G.F., Taira, A., Klaus, A., et al., 2001. Proc. ODP, Init. Repts., 190: College Station, TX (Ocean Drilling Program). doi:10.2973/odp.proc.ir.190.2001
Moore, J.C., 1989, Tectonics and hydrogeology of accretionary prisms: role of the decollement zone: Journal of Structural Geology, v. 11, p. 95-106.
NSF-MARGINS SubFac (subduction factory) research initiative website: http://www.nsf-margins.org/SF/SF.html
Scholl, D.W., vonHuene, R., Vallier, T.L., Howell, D.G., 1980, Sedimentary masses and concepts about tectonic processes at underthrust ocean margins: Geology, v. 8, p. 564-568.
Seno, T., Stein, S., and Gripp, A.E., 1993. A model for the motion of the Philippine Sea plate consistent with NUVEL-1 and geological data. J. Geophys. Res., 98:17941–17948.
Underwood, M.B. and Moore, G.F., 1995, Trenches and trench-slope basins: in Busby & Ingersoll, eds.; Tectonics of Sedimentary Basins, Blackwell, p. 179-219.
–
Other References on Note:
List of projects and publications from Stanford University’s Crustal Geophysics Research Group.
List of research projects from Harvard Seismology group.
Plate Tectonics I and II modules from VisionLearning website.
Fowler, 2004, The Solid Earth: An Introduction to Global Geophysics: Cambridge University Press, 704 p.
Lowrie, 1997, Fundamentals of Geophysics: Cambridge University Press, 368 p.
Shearer, 1999, Introduction to Seismology: Cambridge University Press, 204 p.
Stein and Wysession, 2003, An Introduction to Seismology, Earthquakes, and Earth Structure: Blackwell Publishing.
Turcotte, 2001, Geodynamics: Cambridge University Press, 528 p.
A great popular/nontechnical book is Naomi Oreskes ‘Plate Tectonics: An Insider’s History of the Modern Theory of the Earth’.
Trackbacks
- Subduction Denialism, Part 1: The Backstory « Clastic Detritus
- Subduction Denialism, Part 3: Sedimentation in the Cascadia subduction zone « Clastic Detritus
- The Fatal Law of Gravity (repost) « In Terra Veritas
- Just for kicks pt. 2, or the Expanding Earth Hypothesis « Glacial Till
- Describe What Happens At A Subduction Zone | Bolakovic3
- But Unless Owners Of The Systems That Are Plagued With Code Red II Take Action, The Worm Will Still Continue To Scan The Internet Until The End Of September, When It Is Set To Self-destruct, According To EEye Digital Security's Analysis - The Interne
- - Hot News In Tech
- Jeff Winchell, Who Runs A Site Called Nader's Traders From Seattle, Said That He Will Not Take Down His Site Because Of The California Law - Hot News In Tech
- "Instead Of Saying Identity And APIs Were Different Things, We Wanted To Build Them Together And Make Them Work Together," Recordon Says - Hot News In Tech





dude, you are so wasting your time.
Instead of all these mega posts, you could have just said:
“10Be”
The expanding Earth hypothesis is a historical relic allowed by the fact that spreading ridges were discovered first. In 1959, It was creative and clever. By 1969, it was silly.
Unfortunately, it had a charismatic and well-spoken advocate in the form of S. W. Carey, who in the words of some of my advisers, “gave the best presented talks ever to grace this auditorium.”
Why people are attracted to well-spoken charismatic figures who claim to have all the answers is not a scientific question.
Actually, Harry Hess (I think) was involved in gravity measurements in the 1930s which showed a significant mass deficit associated with the trenches in places like Indonesia, which he did propose was due to a subduction-like process (descending convection currents, following the suggestions of Arthur Homes). So in a sense, subduction zones were discovered first.
Nice posts, Brian. It reminds me of the times I spent debating magnetic field reversals and plate tectonics with a “catastrophic plate tectonics” enthusiast. He refused to believe you could get convection in the outer core even when I showed him that despite the uncertainties in parameters like viscosity, you were still 10-20 orders of magnitude above the critical Rayleigh number. Good times…
Arthur Holmes, of course. Sorry.
Lab Lemming says: “Instead of all these mega posts, you could have just said: ’10Be'”
I was hoping some of those more geochemically inclined would chime in … care to expand?
Chris says: “…gravity measurements in the 1930s which showed a significant mass deficit associated with the trenches…”
Interesting … maybe you could blog about that someday?
You could have just pointed to geodetic measurements that show the convergent boundaries, you know, converging. Warren Carey insisted that an expanding Earth would affect the assumptions behind these measurements. Fortunately for him, he didn’t live long enough for the uncertainties of the data to leave him without a toehold in reality. For his bastard heirs, like the hedge-fund manager behind Oil Is Mastery and his igor Anaconda, there is not even the illusion of a toehold. But your presentation of geologic evidence is also great and will suffice.
“Fortunately for him, he didn’t live long enough for the uncertainties of the data to leave him without a toehold in reality. ”
He only died five years ago!
OilIsMastery … you left the same exact comment on all three parts of this series … I only kept it on Part 3 … if you have something specific about this post, do it here.
Everyone else … go to Part 3 to see OilIsMastery’s general comment.
I am impressed by those cross sections, that is a neat cross-sectional elevation program you’ve provided. I like that block diagram too. So, those elevation data sets were compiled by NOAA? Cool!
GeoMapApp is a great tool … it’s free and easy to use.
BrianR:
House Keeping:
This post and the subsequent post are the main substantive materials presented by BrianR, the previous post was by way of background. These posts likely will require more than one comment because of their detailed nature requiring a detailed comment(s).
I will address a couple of previous comments before moving on to the substantive material.
Andrew, also known as Geology Guide at About.com Guide to Geology, derisively characterized me as Igor along with some other equally friendly statements. That’s a reprentitive example of the way he handles people who disagree with him. Here is the only debate I’ve had with Geology Guide on his blog: Abiotic Oil and Barack Obama, August 15, 2008
Lab Lemming stated: “The expanding Earth hypothesis is a historical relic allowed by the fact that spreading ridges were discovered first. In 1959, It was creative and clever. By 1969, it was silly.”
No, Continental Drift was dividing the geology community in the early 1960’s because Uniformitarian, “the present is the guide to the past”, was the dominant principle in geology at the time. Continental Drift theory violated that principle. A reasonable and logical conclusion after observing spreading ridges was that the Earth Expanded, that idea was even more offensive to general principles of Uniformitarianism.
But the evidence for spreading ridges was overwhelming.
Subduction was hypothesized as a way to eliminate the need for an expanding Earth. This “solution” while disagreeable to some of the old guard was considered perferable to a shattered geological community, or Expanding Earth theory, which threatened even more to shatter the geological community into rival unreconcilable factions.
Subduction was quickly “mainstreamed” by the “leading lights” in a rush to judgment. Science was made to “fit the theory” and papers were published with the assumption that subduction was fact.
Unproven assumptions are the most dangerous ideas in science.
By 1970, “group think” gained control and Subduction theory “ran the table”, however, a minority, albeit small, did not rush to judgment and have continued to publish papers demonstrating Expanding Earth theory to this day and as time passes more scientific evidence accumulates for Expanding Earth theory.
Now on to the substantive data and observations presented by BrianR.
BrianR:
I know I stated it once before, but needs to be said again, your technical mastery of presentation is evident.
The bathymetric images combined with the profiles are excellent — I only wish I had the technical ability you display. These posts are a resource in themselves, acknowledging your disclaimer to the contrary.
Starting off from the very top, while you state these are subduction zones, which you are entitled to, there is nothing evident in the bathymetric and profiles which suggest that is acutally how they function.
I try to keep learning and do change my views upon new evidence. Neal Adams comments on subduction make sense. I will associate with the foregoing quote from Neal Adams.
“Is there Compressive subduction at the ring of fire and some few other places?
SURE!. There is also Compressive “Obduction”. There is also COMPRESSIVE MOUNTAIN BUILDING. You can’t have massive spreading SO EVENLY that you don’t get “some” compressing. Hell, it’s a “GROWING PLANET-GROWING UNIVERSE” . Yep, that’s what the theory is called now.
A bit cumbersome, I’ll admit, but I’m not selling tickets to a movie, I’m being descriptive.
Heres a couple of ?”FACTS” 1. According to the Crustal Age Map, if you examine it VERRRY carefully, Subduction began about 60 MYA.
What caused it to happen??
Well, compression, of course, But as it turns out about 60 MYA Antarctica tore loose from Australia, AND ALL AROUND BEGAN THAT MASSIVE NEW SPREADING Antarctic Ocean.
Thing is,….with spreading happening all around Antarctica 360 degrees… it all pushes away against itself. Even the rift is traveling upward!
So UPWARD-PUSHING the Australian plate is shoved like a battering ram. The western pacific is no longer spreading and Australia SHATTERS the OCEANIC PLATE INTO PIECES.
The CURVED Western Pacific oceanic plate on a RE-CURVING EARTH digs its edges into the broken plate and begins to subduct under the shattered plate there at the ring of fire , about 60 MYA.
In some areas nearly a hundred miles of oceanic plate may have subducted.
But IT COULDN’T HAVE subducted under 60 km thick solid-bottomed Asia
Or gone past the asthenosphere into the DENSE SOLID MANTLE.
But the Atlantic is 4,000/5,000 miles wide.”
I note that in Neal Adams video presentations (most three years old)he stated there was no subduction, evidently, he has modified his views in light of the evidence.
If you want to say, “That Anaconda, he’s just a “me too” guy, I’ll take it on the chin. Adams’ quote makes sense on the idea that the pressuring is uneven, and convergence (pressuring of plates together in some locations has to take place, in fact an expanding Earth would demand that is so) does take place.
The question is the extent of Subduction, does it equal the 40,000 miles of spreading ridges observed around the world.
Oops, I strayed off the your data and observations, sorry.
The “mechanism” of subduction at every point called a “subduction zone” seems to be an assumption. The trenches when seen in profile are underwhelming, even the Mariana Trench isn’t hugely deeper than the surrounding area (okay, it’s pretty deep). This surprised me, perhaps, I was unrealistic to expect more, but “trench” and the way they are talked about, I was expecting deeper trenches.
Let’s talk about “slumping”, no not slumming.
Slumping would seem to be a natural result of large scale rifting. The edges of the continents “slough” off into the adjoining rift area. This phenomenon is entirely consistent with Expanding Earth theory. The profiles would seem to bare that out.
The trenches, yes, there are trenches, whatever I may think of their size. It seems that on an expanding Earth, not only is there expansion, there is “stretching”, in areas adjacent to orogenic expansion (using the geosynclinal theory). Similar to the idea of “ying” and “yang”, sorry for that non-technical term, call it a metaphor, oops — I know you don’t like that, my bad.
Let’s turn to the hardest part for Expanding Earth theory to explain, the subsea-floor seismic imaging.
According to Expanding Earth theory the granitic continental plates all formed at the same time of roughly the same material. Then starting some 200 m.y.a a new kind of material was being created basaltic oceanic crustal plate. Presumably (okay, that a give-away word for “assumption”, a big no, no), this started being created in a shell all over the world, meaning basaltic oceanic crustal plate formed also UNDER the granitic continental plate at the same time it was spreading out in the ocean rift zones. So the curve you see arching under the continent in the images, is not basaltic oceanic crustal plate “driving” under the continent, but simply where the besaltic oceanic crustal plate arches up from being confined under the weight of the granitic continental plate which, as you know can reach down 30 or so miles.
In other words, the basaltic oceanic crustal plate is being “unmasked” where it is allowed to come to the surface, after being “masked” under continental plate.
Taking the “weight off” of the basaltic oceanic crustal plate allows it to be an “expressed” feature. Of course, without the weight on top of it it will arch to the surface causing the seismic image you see.
What assumption that Subduction theory assumes is that this arch is driving or moving under the continent. Expanding Earth theory suggests is is more a “static” arch that isn’t driving anywhere.
Except for that fact that even in Expanding Earth theory there is joustling, pressing, and stretching going on at the same time, an uneven process at best.
Well, I’m sure, this critque won’t satify those who fervantly believe in subduction theory, but it seems to be a start.
I need to digest and think, I may come back for follow up on this post, I’m not sure. I’m sure of one thing, I know I haven’t covered every jot and tittle.
BrianR, if you think I’ve made a glaring omission, you’ll let me know, I’m sure. Then I will address what I’m specifically asked to address.
Otherwise, I will move on the the Cascadia Subduction Zone. That is where the discussion started and perhaps, that is the place to get in more detail (if I’m capable).
Anaconda says: “…while you state these are subduction zones, which you are entitled to, there is nothing evident in the bathymetric and profiles which suggest that is acutally how they function.”
I apologize for assuming … please feel free to interpret the physiography how you see fit. Why is the physiography of these continental margins the way they are? You need not even mention subduction if it doesn’t exist … how does the model of the Earth you advocate explain these margins? Be specific.
Anaconda says: “The trenches, yes, there are trenches, whatever I may think of their size. It seems that on an expanding Earth, not only is there expansion, there is “stretching”, in areas adjacent to orogenic expansion (using the geosynclinal theory).”
I’m sorry, I don’t understand that … please expand and clarify.
Anaconda says: “According to Expanding Earth theory the granitic continental plates all formed at the same time of roughly the same material.”
I say nothing about composition here … why are you bringing up granite? Look at the data, address the observations and geometry (nothing about composition), how does the model of the Earth you advocate account for these data?
Anaconda says: “BrianR, if you think I’ve made a glaring omission, you’ll let me know, I’m sure. Then I will address what I’m specifically asked to address.”
As I say above … you need not even mention subduction … if it doesn’t exist as you claim/suggest then you need not even utter the word ever again. You should be able to account for these data. Again, I apologize if my statements are presumptuous. Just interpret the data.
BrianR:
BrianR states: “I say nothing about composition here … why are you bringing up granite? Look at the data, address the observations and geometry (nothing about composition), how does the model of the Earth you advocate account for these data?”
Brian, composition is integral to structure. It’s like describing the structure of a highrise building without mentioning the qualities of the structural steel holding it up. The composition explains the structure.
To the extent your presentation ignores the composition, it’s failing to address a necessary component explaining geological structure. My analysis can’t be limited by that failing.
For that reason, I will continue to refer to composition when necessary to articulate my ideas with regard to structure and dynamic mechanisms in the geological features.
BrianR states: “Why is the physiography of these continental margins the way they are?”
I did addressed several issues: Slumping, orogenic formation, stretching, and the arch of basaltic oceanic crust.
But I will address each of those in more detail and also add in volcanic activity, as that is a component of the structure that subduction theorists rely on greatly in arguing for subduction which I failed to address.
(more to follow)
Anaconda … I didn’t mean that composition wasn’t important. You’re absolutely right, it is indeed important – I was just confused about how your comment on granitic crust was specifically addressing the data above.
Anaconda says: “…the basaltic oceanic crustal plate is being “unmasked” where it is allowed to come to the surface, after being “masked” under continental plate.”
and
expanding Earth hypothesis suggest the arcward- or continentward-dipping oceanic crust “is more a “static” arch that isn’t driving anywhere.”
Okay … so you’re saying that the oceanic crust is static (i.e., not moving) in the second statement, but I guess I’m confused then on the ‘unmasking’ process you describe in the first statement. I don’t want to misinterpret what you are saying … but, having oceanic crust “come to the surface after being masked” sounds more dynamic. Perhaps you can elaborate?
Anaconda says: “The trenches when seen in profile are underwhelming, even the Mariana Trench isn’t hugely deeper than the surrounding area (okay, it’s pretty deep). This surprised me, perhaps, I was unrealistic to expect more, but “trench” and the way they are talked about, I was expecting deeper trenches.”
The Peru-Chile and Mariana trenches are on the order of ~2,000 m (6,500 ft) deeper than the adjacent oceanic floor … you could stack about five Empire State buildings in there.
I’m not sure what you mean by ‘underwhelming’ and what that means for explaining their origin. Whether or not you are struck by their size/depth doesn’t matter much though – you can choose not to think features on the Earth’s surface are intriguing or interesting – this doesn’t change what they are.
Anaconda says: “Slumping would seem to be a natural result of large scale rifting. The edges of the continents “slough” off into the adjoining rift area. This phenomenon is entirely consistent with Expanding Earth theory. The profiles would seem to bare that out.”
I’m sorry but I’m confused again … are you referring to these continental margins specifically (i.e., the ones I show in the bathy maps/profiles)? Are you saying that these are rifted margins? Before I misinterpret your statement, please clarify.
In addition to clarification of these being rifted margins, can you clarify which data above indicates slumping? Are you referring to Fig. 7?
I put figure numbers on these for a reason – so readers/commenters can easily refer to them – so things don’t get confusing.
BrianR:
You are right to want clarification. First attempts often fall short of desired results. This is a “work” in progress and I welcome your questions which allow me to clarify.
The terms, “masked” and “unmasked” are obviously not terms of art. What I was trying convey is that basaltic oceanic crust is present below the continents, thus their presence is covered over by the continent or “masked”. At the edge of the continent it becomes “unmasked” or exposed, not because it’s moving anywhere, but because the weight and bulk of the continent ends, allowing the basaltic crust to form an arch, this arch formed shortly after the continental crust rifted apart, according to Expanding Earth theory this continental rifting started happening about 180 million years ago.
So, the arching would have happened roughly 180 million years ago, or whenever that particular spot rifted apart.
That’s why the arch is not particularly “active” in present geological time.
Of course, there are exceptions to the general theory.
Expanding Earth theory posits that the oceanic basins are essentially giant rift basins. The two continental plates rift apart and the spreading ridge forms in the basin between the two opposing edges of the respective continents. As the spreading ridges erupt new basaltic oceanic crust, the Earth expands and the continents spread apart.
The oceanic basin between South America and Africa is the best example of this description. (I’m not trying to go beyond your data and observations, I’m simply giving a well known example.)
After rifting, the edges of the continents start out as vertical walls, which weather and sustain earthquakes resulting in material “sluffing” off the face and coming to rest at the base of the face.
I stand corrected on the depth and magnitude of the trenches.
No, continental edges aren’t presently rifted margins. 180 million years ago continental edges were rifted margins when the two edges were touching, but as the Earth expands the spreading ridge moves away as basalt rises from the spreading ridge forming sea-floor.
The above are general principles of Expanding Earth theory — I will address the specifics of the data and observations provided in the post in a subsequent comment(s).
(more to follow)
Anaconda says: “…the weight and bulk of the continent ends, allowing the basaltic crust to form an arch, this arch formed shortly after the continental crust rifted apart”
Why is the oceanic crust under the continent? If it formed at a spreading center, how did it get under the continent?
BrianR:
Good question. According to Expanding Earth theory, the Earth produced grantitic crust which entirely covered a smaller globe, at some point in geologic time, perhaps around 180 m.y.a., for an unknown reason the Earth began producing basaltic crust (even under the continents) which is denser and more brittle than granitic crust, thus the granitic crust was pushed up from underneath. At some point not only did it form underneath, but also rose and erupted to the surface at the spreading ridges which now total about 40,000 miles in length.
Moving on to the specific data and observations, the basaltic crust is denser and more brittle than grantitic continental crust as reflected by the P waves shown in figure 9. This diagram shows the denser oceanic crust in dark blue. “P” stands for pressure.
In this next section I focus on the vocanic ranges and trenches depicted in the various figures and discuss and analyse the relationships between their distance, height, and bulk.
Looking at figure 1a. the distance between the volcanic mountain range (Cascade Range) and the area of alleged subduction is the farthest distance among the figures presented. Next comes figure 6a. from Japan, and then figure 3a, from Sumatra. next comes figure 2a. from South America, and then figure 4a. from the Aleutian Arc and finally the figure 5a. of the Mariana trench.
What is the organizing principle in this order?
It seems that the closer the volcanic mountains are to the trench, the higher and more active the volcanic vents, and the greater the bulk, the deeper the trench.
Starting in reverse order from the Mariana Trench in figure 5b. notice how it shows that the vocanic range is right next to the trench, and the height, not accounting for sea level, is substantial, as well as its bulk. Then in figure 4b. the Aleutian Arc volcanoes are slighly farther away from the trench and the trench is a little less deep, but it is an “active” volcanic range with a well defined volcanic ridge and again substantial bulk. Then figure 2b. shows the the distance and height of the Andes Mountain Range. Again notice that the bulk and hight is slightly farther away than either the Mariana’s example or the Aleutian’s example. Figure 3b. shows the Sumatra distance, hight and bulk, The actual mountains seem relatively small, but the face of the plate is vertical, suggesting relative “youth”. In figure 6b. from Japan, again the mountain height and bulk is relatively subdued compared to the deeper trenches and its trench is also minimal, but it does have a fairly steep face. Figure 1b. shows the cascade range and as noted before, the distance is greatest, there is less height and less bulk (with little or no trench noted).
There seems to be a corollary between depth of trench and the distance between the trench and the mountain range as well as the height and bulk of the mountains.
Why is this relevant?
It goes back to the quality of the basaltic oceanic crust and as previously argued how it wraps (arches) around the edge of the continental plate or island arc. Because basaltic crust is brittle, the more it has to “stretch” and curve as it wraps around the edge of the continent or volcanic arc, the more it fractures allowing hot magma to extrude and erupt up though it, this further weakens the basaltic crust allowing it to flap-up like a “crease”, also the deeper the grantitic crust reaches down (is thicker), the more bulk, the more the basaltic crust “creases” or hinges up from a deeper level in the stratigraphic column. The Cascade Range is furthest from the alledged subduction zone and is a shallow moutain range with less bulk so the basaltic crust has more distance to curve up, allwoing for a more gentle upslope and it doesn’t start at as deep a level on the stratigraphic column. The Mariana Trench has the closest mountains with the deepest base in the continental crust (significant bulk), therefore the basaltic crust “hinges” from the deepest level on the stratigraphic column of all the figures shown.
In figuure 9., volcanoes are not the product of basaltic oceanic crust “driving down” under the continental crust, rather the vocanoes are a product of fracturing in the basaltic oceanic crust as it stretches and curves under the mountain ranges because of the brittle nature of the basaltic crust under the bulk (weight) of the mountains. The “P” wave diagrams in figure 9. suggest that the basaltic oceanic crust never undergoes wholesale melting as it gets deeper on the stratigraphic column under the continents. Subduction theory relies on the idea that the basaltic oceanic crust melts and is reabsorbed into the mantle. The “P” wave diagrams don’t provide any evidence that is indeed happening. In addition, it is understood that the mantle itself, below the basaltic oceanic crust does not melt wholesale either, but at best undergoes partial-melt in limited areas. Certainly not to the extent required by Subduction theory. The “P” wave diagrams in figure 9. don’t provide and evidence that the mantle is undergoing wholesale melting either.
Figure 7. of the Nankai Trough and Kumano Basin doesn’t provide any evidence that Subduction is happening in that areaa, at best it suggest that there is some compression, but without Subduction. The steep face suggests little deformation in that area which would come with subduction.
Figure 8. the slumping also doesn’t provide any evidence of subduction, rather, it suggests “sluffing” of the face, or it could be described as collasping of the face of the continental edge due to seismic and volcanic activity as a result of fracturing and fissuring of the basaltic oceanic crust allowing some magma to “push up” displacing less dense continental grantitic crust. Where basaltic oceanic crust comes into contact with continental crust, because the basaltic crust is denser, continental crust can be and likely will be displaced.
Figure 10. shows seismic activity in the Pacific Basin. The most seismic activity and the deepest activity happens in areas with the most active and deepest rooted volcanic systems. Again, that is because the basaltic oceanic crust has suffered the most stretching and deformation, causing fissuring. Because of the depth of continental crust, this in turn allows magma to rise causing seismic activity. Eathquake activity by itself provides no evidence that subduction is happening. It only shows there is vocanic activity and mountain building activity which by themselves again says nothing about whether subduction is happening or not.
Figure 11. is a cool color image, but doesn’t provide anymore data or observations than figure 9. that indicate basaltic oceanic crust is driving under the continent. An equally valid interpretation is that basaltic oceanic crust is elevating in the stratagrphic column because the continent is no longer sitting on top of it. There is serpentinite diapir formation suggesting hydrothermal activity, possibly abiotic oil generation. Notice the vertical fault lines under the serpentinite diapir formation, this is a product of faulting and fracturing because of the deformation and stretching of the crust, and the brittle basaltic crust elevates because it ceases to be covered by the weight and bulk of the continental crust (even though it is less dense).
See the reverse horizontal arch under the orogenic mountains in figure 11. This is a result of the added weight pressing down on the material causing the reverse arch.
Figure 12. shows the “broken and fragmented” nature of that section displayed in the image. It is an inconsistent pattern providing little imformation that directly shows subduction (I understand Tonga is where almost all geologists, even Expanding Earth geologists believe at least some subduction is occuring), it’s just that particular image reveals little information.
Figure 13. doesn’t shed a lot of light on subduction, but it suggests there is some degree of compression along both the Pacfic and Atlantic coast of Costa Rica.
Figure 14. shows in the darker green shaded area at the bottom of the diagram upthrusting wedges as a result of fracturing of the basaltic oceanic crust as it elevates upward after the continental crust’s bulk ceases to weight it down. There is also a possibility of upward pressure from the mantle level causing the dark green shaded wedges. It would seem these features are not consistent with slab-pull down which is necessary for Subduction theory. This fracturing would also encourage slumping which is seen above the dark green shaded area in the tan shaded area with multiple verticle fracture lines. The credit in the figure, http://www.netl.doe.gov/technologies/oil-gas/FutureSupply/MethaneHydrates/about-hydrates/nankai-trough, suggests the upward migration of minerals (oil) and hydrothermals which further suggests, rather than oceanic crust driving down under the continental crust, that oceanic crust is fracturing and fissuring from being “stretched”, while being relatively static, allowing heated water to rise after being heated in the deep crust.
In summary, an alternate interpretation can be made of these geologic features because the diagrams, maps, and images don’t provide data and observations that compel an observer to conclude that subduction is happening. Rather, at every corner it’s assumed subduction occurs, so that even though a feature is ambiguous as to oceanic basaltic crustal movement (function), subduction is given the benefit of the doubt, and in several cases outlined above this benefit of the doubt goes against the weight of the evidence leading to the unwarranted and erroneous conclusion that subduction occurs.
Subduction can’t be concluded from the above data and observations because an equally plausible interpretation consistent with the data and observations can be made without reference to the supposed subduction mechanism.
Anaconda … thanks for taking the time to actually look at the data and offer your interpretations. Not many others are willing to do that, especially so comprehensively.
Firstly, just an FYI, the ‘P’ in P-wave does not stand for pressure. P-waves are the first, or ‘primary’, seismic waves to arrive. S waves, also known as shear waves, arrive next and are therefore ‘secondary’. See here.
Re the bathy maps/profiles, you state: “There seems to be a corollary between depth of trench and the distance between the trench and the mountain range as well as the height and bulk of the mountains.”
I wish you had quantified this part, I had a difficult time following your description of what was what. By ‘height’, you mean the elevation difference? And, you will definitely have to define, and ideally quantify, what you mean by ‘bulk’.
Regarding distances between trench and arc, here are the numbers I came up with (in ascending order):
Nankai (Fig. 6b) – 160 km
Aluetian (Fig. 4b) – 165 km
Mariana (Fig. 5b) – 200 km
Sunda (Fig. 3b) – 260 km
Chile trench (Fig. 2b) – 260 km
Cascadia (Fig. 1b) – 310 km
If you do mean elevation difference between trench and arc (instead of ‘height’), then I came up with (in descending order):
Chile – 10500 ft
Mariana – 7500 ft
Aluetian – 7200 ft
Sunda – 6800 ft
Nankai – 5550 ft
Cascadia – 4000 ft
(*note: these numbers aren’t precise down to the foot, but within a couple hundred feet. I did them quickly, you could re-do them if you want [I provide scales on all profiles])
You then say: “It seems that the closer the volcanic mountains are to the trench, the higher and more active the volcanic vents, and the greater the bulk, the deeper the trench.”
I suppose the Cascadia fits your relationship, but don’t really see it anywhere else. You will need to quantify your other parameter – ‘bulk’. Ideally, one would then do this for numerous transects across the boundaries (they change along strike) and for all the boundaries of this type. Perhaps then you’ll find a robust relationship.
But … fair enough … you looked at the data, came up with a relationship (that I couldn’t reproduce, but anyway), and proposed an explanation. As I said above, at least you put the work in!
–
You say: “Because basaltic crust is brittle, the more it has to “stretch” and curve as it wraps around the edge of the continent or volcanic arc, the more it fractures allowing hot magma to extrude and erupt up though it, this further weakens the basaltic crust allowing it to flap-up like a “crease”…”
You mention the brittleness of basaltic crust several times. Are you saying that basalt that is 10s to 100s km deep in the Earth is more brittle than continentental crust at the surface? Maybe, I’m misunderstanding. Also, I didn’t take the time to look it up, but researchers have done experiments on rocks of many compositions investigating under what conditions they would fracture in a brittle fashion. Of course, temperature and pressue have a huge influence on this. I’m sure a basic structural geology textbook has the necessary charts and information … this might shed some light on your brittle basalt hypothesis.
You say: “volcanoes are not the product of basaltic oceanic crust “driving down” under the continental crust, rather the vocanoes are a product of fracturing in the basaltic oceanic crust as it stretches and curves under the mountain ranges because of the brittle nature of the basaltic crust under the bulk (weight) of the mountains.”
So, the oceanic crust gets under the continent because it is brittle? I don’t get it. If it is ‘stretching’ under the continent, isn’t its relative motion then going under the continent? My readers will definitely be interested in having you expand and clarify.
–
You say: “Figure 7. of the Nankai Trough and Kumano Basin doesn’t provide any evidence that Subduction is happening in that areaa, at best it suggest that there is some compression, but without Subduction.”
So, you agree that the area, which has been termed accretionary wedge (you can call it whatever you like), is formed from compression? Good, we are in agreement. You already know what conventional theory says regarding the mechanism for that compression (i.e., plate convergence) – I’m curious how you envision compressional deformation w/in the context of your no-subduction model. Care to elaborate?
You say: “Figure 8. the slumping also doesn’t provide any evidence of subduction, rather, it suggests “sluffing” of the face, or it could be described as collasping of the face of the continental edge …”
Of course slumping, by itself, doesn’t indicate subduction. I never said it did, don’t play that game … it’s a waste of everybody’s time. It’s not my figure, I didn’t take the time to redraft it and remove annotation. The slumping does indicate a high-relief and active submarine slope with material that can relatively easily slump (i.e., sediment not rock)… but, you’re right, that by itself doesn’t address subduction.
You say: “Where basaltic oceanic crust comes into contact with continental crust, because the basaltic crust is denser, continental crust can be and likely will be displaced.”
Are you saying that denser basaltic crust is uplifting and displacing the overlying continental crust?
You say re the seismicity distribution: “Because of the depth of continental crust, this in turn allows magma to rise causing seismic activity.”
Because of the depth? What depth of continental crust? Again, I’m sorry … I’m simply not understanding you. I don’t want to misunderstand and then mis-state you. Also, the bottom map (Fig. 10b) shows just the deep events … what makes those areas different than the shallow events, which are distributed along all plate boundaries?
You say: “Figure 11. is a cool color image, but doesn’t provide anymore data or observations than figure 9. that indicate basaltic oceanic crust is driving under the continent. An equally valid interpretation is that basaltic oceanic crust is elevating in the stratagrphic column because the continent is no longer sitting on top of it.”
Elevating from what? Is it formed much deeper and rises as a semi-coherent slab? I don’t get it.
You say: “Figure 13. doesn’t shed a lot of light on subduction, but it suggests there is some degree of compression along both the Pacfic and Atlantic coast of Costa Rica.”
You say: “Figure 14. shows in the darker green shaded area at the bottom of the diagram upthrusting wedges as a result of fracturing of the basaltic oceanic crust as it elevates upward after the continental crust’s bulk ceases to weight it down”
Maybe I’m starting to understand your idea here … you are saying that the oceanic crust, when it fractures, thrusts itself up resulting in this imbricate fold-thrust belt? I don’t see how fracturing, which you say above is from stretching, produces upward-thrusting like this? There are fold-thrust belts on continents (i.e., not involving oceanic crust) that show similar geometries, are you saying they form under an analogous mechanism?
Finally, you say: “In summary, an alternate interpretation can be made of these geologic features…”
I agree, alternate interpretations can be made. I’m glad you offered yours to everybody. But, I hope you don’t think you’re done … proposing the idea is just the beginning. There are tons of ways to now test your ideas. I’ll be excited to see how you will do that.
NOTE TO COMMENTERS: I will be traveling and away from computer – I am shutting down comments (too much spam). I will comment again right here when it is open.
One of the basic problems with an expanding earth is addressed in an article I wrote called, “Beyond Plate Tectonics: ‘Plate’ Dynamics” for Infinite Energy Magazine. Specifically, if you have a planet that was 55% of its present diameter before expansion occurs, it would have roughly 1/6 the volume of the earth today. Absent massive bolide addition, the average density of the core would be vastly greater than any substance known to man, and the average density of the crust would be about as dense as gold.
Any discussion of how an expanding earth can occur that doesn’t deal with densities before and after expansion, misses the obvious.
comments are open again
DEAR MR. CHRIS ROWAN
CAN YOU GIVE ME A LITTLE DEFINITION OF YOUR MAGNETIC FIELD REVERSAL
IS IT THE REVERSAL THE MAGNETIC FIELDS DUE TO THE TRANSFER OF LOCATION OF THE PLATES
I’M AN AMATEUR STUDENT TRYING TO LEARN
IS THEIR ANY MAJOR MOVEMENT OF PLATES IN THE PAST CENTURIES
Hello, I wonder if you have a topographic profile of the eastern portion of the U.S.. And if you can send me e-mail is flavinha_sitko@hotmail.com. . Thank you
I think, this is a conspiracy to ruin our home prices on the Oregon Coast and inland! Back in the 1980’s there was a article in the Oregonian, if I remember right. They called and showed on a map that the Oregon Coast was ecotopia. The “Green” fanatics along with the State of Oregon, are determined to keep people out and to ruin our economy. For over a year now, our radio stations have been putting out freightening warnings by the State of Oregon.
Face it, they want us out.
They are telling us that it would or could be possibly months before we would get help and nothing would be fixed for years if there was an major earthquake.
Oregon residents from the I-5 west should sue their state government and the scientists making these claims. The Oregon Coast is mostly mountainous. The land would shake but it would be pushed upward not downward. That is why we have a coastal range which is being thrust up. Oregon residents should sue because it is ruining our economies.
In Sumatra, the tsunami, only rolled in 20 miles over mostly flat marsh. They are telling us it is going to go inland 80 to 100 miles and the I-5 will liquify. This B.S. They are guessing and are ruining our little economies along our coast and even inland. They have tried to ruin the forest industries in the past. They don’t let us do anything with our land, especially if it is a large parcel. They want us out of here, so now they are trying to scare us to death!
I love this state but almost hate our sick green politicians. They are spineless and want ecotopia for themselves as their personal playground. I haven’t made any of this up, it has all been said in the past by other people in our state.